Actionable ideas for the busy trader delivered daily right up front
- Tuesday uncertain.
- ES pivot 1344.17. Waiting for a decisive move above or below.
- Rest of week bias lower technically.
- Monthly outlook: bias down.
- ES Fantasy Trader standing aside.
The Dow was down almost 200 point right out the gate this morning, reflecting the storm clouds we noticed in the charts on Sunday evening. But once that was out of the way, it was pretty much a steady grind back up to finish at 12,721 for a full 50% retracement. Was this the summer thunderstorm that clears the air, or is there more rain on the way? You don't need a weatherman, all you need are charts and we got 'em. Read on...
The technicals (daily)
The Dow: Much was made in the press today about the Dow's second "triple digit loss" in a row. OK, 101 points down is bad but it's not the 400 point swoons we were getting this time last summer. And more importantly, today's candle was not solid red, it was a hammer. Nevertheless, the indicators are all clearly in downward mode from overbought, so it would be premature to be calling for a Dow reversal just yet. Still I can't help but come back to the way this hammer formed - it was a big dump out the gate followed by a pretty steady retracement.
The VIX: Today, not surprisingly, the VIX took a giant pop to jump over 14% - but it did it on a long red candle that just touched the upper BB. As I've often noted, the VIX rarely spends more than a day or two at its upper BB before reversing. Given the fact that the touch occurred at the open and the VIX was actually down big on the day, I'd be surprised if we retraced this whole decline on Tuesday. Plus we've now got a big gap that's looking to be filled. Still, the indicators have not yet reached overbought. On the other hand, the last three times the VIX peaked, the indicators never reached overbought. Plus, the futures put in a big gap-up evening star today on high volume which would support the idea of a VIX reversal. So all in all, I wouldn't be surprised to see th VIX move lower Tuesday.
Market index futures: Tonight all three futures are just ever so slightly in the green at 1:03 AM EDT with ES up by 0.06%. While we did fall out of the rising RTC for a bearish trigger, we've also come down so far that the indicators are already nearing oversold levels and the stochastic is within two days of forming a bullish crossover. And the lack of continued downside in the overnight so far (unlike last night) at least suggests the possibility that we've reached some sort of support at these levels.
ES daily pivot: Tonight the pivot drops from 1362.42 to 1344.17. With ES essentially flat in the overnight so far, this puts us exactly on top of the new number. Seeing which direction ES eventually decides to go will say a lot about Tuesday's close.
Dollar index: The dollar took a big pop today but did it on a red gap-up inverted hammer. The close of the $USDUPX at 57.84 tested, but failed to breach resistance at 58. Although all the indicators are now off oversold and moving higher, this sort of candlestick is at least a warning that the dollar might move lower Tuesday, which would help out stocks.
Euro: Interestingly, while the dollar gained big time, the euro did not fall correspondingly on Monday. After hitting a low of 1.2076, just above my target of 1.20, it rallied to end with a doji. The indicators here are still oversold and the stochastic has yet to form a bullish crossover. Still, the euro is forming a green candle in the overnight suggesting it may have found a modicum of support here. This should also help out stocks.
Transportation: Today the trans gave us another big loss, down 1.18% that punched under the 200 day MA but forming a fat hammer in the process, more of a mallet actually. They also touched the lower BB intraday. So far, there's nothing to suggest the developing pattern won't be like the other three times we went under the 200 day MA going back to May. If this holds true, then we might expect a positive day for the trans within a day or two. The hammer itself is a reversal indicator, but one that requires confirmation.
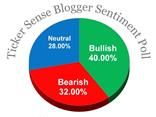
Sentiment: Once again it's time for the latest weekly TickerSense Blogger Sentiment Poll. We continue to track the poll to see how well it performs. Here's the updated cumulative list for this year:
Wk.# Week % Bullish % Bearish NightOwl SPX Accuracy
1 1/3 46 21 + 1258 1/1
2 1/9 56 37 + 1278 2/2
3 1/17 41 33 + 1289 3/3
4 1/23 46 32 + 1315 4/4
5 1/30 48 31 + 1316 5/5
6 2/6 56 30 + 1345 6/6
7 2/13 48 31 + 1343 7/7
8 2/21 44 32 + 1361 8/8
9 2/27 48 24 + 1366 9/9
10 3/5 43 26 + 1370 10/10
11 3/12 46 32 + 1371 11/11
12 3/19 46 29 + 1404 11/12
13 3/26 39 29 + 1397 11/13
14 4/2 42 21 + 1408 11/14
15 4/9 25 46 - 1398 12/15
16 4/16 26 48 - 1370 13/16
17 4/23 30 48 - 1379 14/17
17 4/23 30 48 - 1379 14/17
18 4/30 44 32 + 1403 14/18
19 5/7 23 50 - 1350 15/19
20 5/14 32 44 - 1353 16/20
21 5/21 30 52 - 1295 16/21
22 5/29 35 42 - 1318 16/22
23 6/4 32 48 - 1278 16/23
24 6/11 28 40 - 1326 16/24
25 6/18 39 26 - 1343 16/25
26 6/25 38 46 - 1335 16/26
27 7/2 41 40 - 1362
28 7/9 42 38 - 1355
29 7/16 44 32 - 1357
30 7/23 33 42 - 1363
Again, the SPX number is the closing price of the S&P on the Friday before each new poll comes out. The "NightOwl" column is how I voted. Since the poll is for 30 days out, after the first four weeks we're able to see how well we did. This week we see that my bearish call on 6/25 was wrong (again), the S&P now being higher than then. I take some comfort in the fact that the poll as a whole was wrong that week too. I'm using the column "Accuracy" to track my calls. So now I'm 16 for 26 . After an impressive start this year, my monthly calls have now been wrong for seven weeks running. For the record, I voted bearish once again this week, based on my reading of the SPX monthly and weekly charts.
This week we see an impressive change of heart in the poll. The majority is now joining me in voting bearish. However, I note that there were eight weeks of even greater bearish sentiment this year so far. I think what we have here is cause to worry, since the readings aren't sufficiently extreme as to be contrarian bullish.
Accuracy (daily calls):
Month right wrong no call conditional batting Dow
average points trade
April 7 9 2 .438
May 10 7 3 2 .632
June 8 6 6 1 .600 632 +$330
July 10 0 4 1 1.000 838
And the winner is...
Alert reader Daniel called this market "tricky and treacherous" tonight and truer words were never spoken. Right now, the general gist of the charts might be summarized as "the worst is over" but it's premature to declare an all-clear. I'll note that the TLT hit its upper BB today while copper hit its lower BB. Treacherous indeed. And clearly the overnight ES boys sense this too, as ES has been just threading around the pivot looking for direction as I've been assembling this post. Fifteen minutes ago we were a point below, now we're a point above.
Tonight I'm seeing a lot of contradictory messages in the charts, with candlesticks pointing one way while indicators point the other. The conventional reading here would suggest we're going lower again on Tuesday, but something's holding me back from calling that. I keep coming back to the fact that the futures are not guiding lower tonight. In fact ES jumped out of two different descending RTC's on its Monday hourly chart. It really feels like the selling pressure is abating and in the resulting slack tide one can get a variety of curls and eddies before the next wave comes in. (How's that for a nautical metaphor?)
So bottom line, this one is too tough for me, so no call for Tuesday. If I had to take a wild guess I'd say we might get another hammer day Tuesday, but I'm not making that official. And I don't think we'll get another triple digit loss day for the Dow. I'll also hazard that when and if ES ever makes up its mind which side of the pivot it wants to move on, that will help determine Tuesday's close. So check that out in the morning - is ES above or below1344.17?
ES Fantasy Trader
Portfolio stats: with no new trade entered last night, the account remains at $168,750 after 52 trades (41 wins, 11 losses) starting from $100,000 on 1/1/12. Tonight we simply stand aside until we can figure out which side of the fence ES is going to come down on.
CUA (Commonly Used Acronyms)
BB - Bollinger Bands
DCB - Dead Cat Bounce
MA - Moving Average
RTC - Regression Trend Channel
YTD - Year To Date
Disclaimer: (My lawyer made me do it) This blog is not trading or investment advice, account management or direction. All trades listed here are presented only as examples of the author's personal trading style. Investing entails significant risk and trading entails even greater risks. Act accordingly.


No comments:
Post a Comment
Due to some people who just won't honor my request not to post spam on my blog, I have had to re-enable comment moderation. Comments may take up to 24 hour to appear, depending on when they're made. Sorry about that.