Friday, March 18, 2011

The reversal, at last

The wearin' o' the green

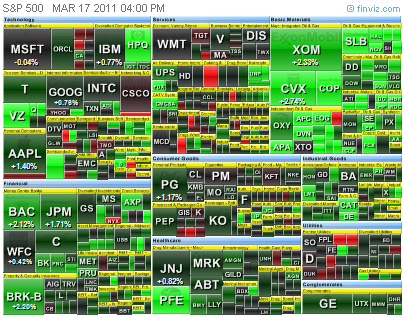
Just in time for St. Patrick's Day, today brought us a welcome sea of green (market heat map courtesy of finviz.com).  There's also an important lesson here in having the courage of your convictions.  After being wrong abut the reversal I just knew had to come, for two days in a row, by last night I just couldn't bring myself to call a bottom.  I did mention though that every time I got the itch to throw in the towel and sell sell sell, that the market always reversed the next day.

And sure enough if that isn't exactly what happened today.  That's the main reason I did not go short or sell everything yesterday.  And now I'm so glad I didn't.

Futures

Moving on to the daily YM futures, we can see a classic parabolic swan dive ending with a big hammer (today's candle).  Since it's now 1:40 AM, the rightmost candle is actually the overnight and look at how that's starting off.  YM is up 0.81%.  And ES is up even more - 0.87%.

This pop also takes us well above the right hand edge of the descending RTC established on March 9th.  This is a bullish setup and there is only a 5% chance that this candle could be part of the downtrend.  Today's G7 intervention in the yen and news of electric power becoming available to run the cooling pumps at the damaged reactors in Japan should help out stocks tomorrow.  Like I said yesterday, it's the temperature in the reactors that's driving the market now.

Pivots

Further good news is that the Dow broke above its daily pivot today and never looked back.  And the VIX broke under its own pivot with a big gap-down at the open.  The only downside at the moment is that tomorrow is a triple witching day and that can lead to lots of volatility.

It's too soon to say if today's gain was just a relief rally of the end of the recent downtrend.  We need to see how next Monday plays out for that.  At least unless some reactor vaporizes in a mushroom cloud tomorrow, I don't see much chance of another huge down day tomorrow  like we've seen the past few days.

A political aside

The only other thing worth watching is our old friend oil.  It's been drifting higher in the overnight.  However, we seem to be back in a positive correlation between oil and the market, so that's not necessarily a bad sign.  Hopefully we can look for some more stability in the Middle East because Col. Khadaffi seems to be on the verge of retaking control of Libya.

I can't say that I'm a big fan of Khadaffi, the man who sent one of his agents to bring down a Pan Am 747 in 1988, but I have no particular sympathy for his opponents either.  I have no doubt that they are the same people who were cheering and dancing in the streets upon said agent's disgusting return to Libya in 2009 as some sort of national hero after being released by the craven Scots on "medical grounds", and where he underwent a miraculous recovery from his supposedly terminal condition.

I don't think it's as important who runs Libya as long as they stop fighting.  Assuming the UN continues sitting on its hands over the proposed no-fly zone and President Nerobama continues fiddling with his basketball brackets while the world burns, Khadaffi might have the time he needs to get back in the driver's seat over there.

Trades

No trades today but with the VIX back under 30, I'm back from my short vacation.  I stuck with my Ford play through its dip yesterday.  OMEX meanwhile seems to be diving like its Zeus underwater robot.  It's nearing some longer term support around today's close of 2.33 so I'll just keep watching it.

Thursday, March 17, 2011

OK, I finally got it

No need to put up any charts tonight.  I may be a bit slow, but I think I have it figured out, finally.  The market is now 100% driven only by the temperature in Japan's nuclear reactor cores.  Temperature up, market down.  Simple as that.  Nothing else matters anymore.  Earnings, yield, sales, supply and demand, forget it.  The entire  fate of the global financial system now hinges solely on three overheated reactors. halfway around the world.

If there's yet another news report of "another meltdown" tomorrow morning, whether it's true or not, look for another 300 point drop in the Dow.  When the reactors are all finally secured, and one has to believe they eventually will be, then the market will go back up.

I'm not even going to bother pointing out any of the positive technical signs I see right now.  Three times bitten, four times shy.  But I'm also definitely not throwing in the towel either.  Every single time I've done this in the past, the market was up big time the very next day.  I'm not falling for that one again.

And whenever the VIX hits 30, I always go on vacation.  That's one of my rules.  I'll be back when some semblance of sanity returns to the stock market.  Life's too short to play this bizarre Kafkaesque game.

Good luck to all you traders out there and deepest sympathies to all the victims of the earthquake and tsunami.

Wednesday, March 16, 2011

Finally some clarity?

Today sure felt like a washout low, featuring an incredible nearly 300 point dive right off the open, followed by a fairly steady retracement the rest of the day. The net result was a pretty decent hammer candle, similar to yesterday's only much larger.

I don't know it this "double hammer" is even an official pattern, but it's pretty unusual. I went over the last 10 years of daily Dow charts and only found four other instances of it. In all four cases, the following day was higher. And the fast stochastic has now done a bullish crossover - that's always a good indicator.

In addition, this evening (at 1:30 AM EDT) the ES and NQ are actually up for a change, +0.14% and 0.11% respectively. And as I write, the YM just turned positive too.  And even the Nikkei is up by over 3.5% now.

Also, the VIX today executed a pretty amazing pattern of its own today, putting in a huge gap up hanging man that broke way above the upper Bollinger band. I looked at the daily VIX back to 2003 and only found four other instances of something like this. In three of the four, the VIX fell the next day. In the fourth case, it fell a day later.

Now I know that what few readers I might still have left are probably shaking their heads by this point, because I've said it a couple of times already and been very very wrong but by gosh, it sure looks to me like we're headed higher tomorrow.

Trades

No trades today, but speaking of going higher, check out this textbook chart. This is Ford. Three important  things happened together here today:

first it broke back above its 200 day MA in a convincing manner, always a bullish sign,

second, it broke up over its descending regression trend channel, a bullish setup,

and third, it put in a huge bullish engulfing pattern that not only spanned yesterday's range, but the five days before that too.

I'm about as certain as I can get this one is going higher. Disclaimer: I'm long F and not planning on selling anytime soon.

Tuesday, March 15, 2011

Just plain wrong

Wow, was I ever wrong about today.  All the signs seemed to be lining up for an advance, and yet we ended up with a 51 point drop in the Dow.  On top of that, as of right now (1:15 AM EDT) we are staring at an appalling 2.08% decline in the ES futures, for no reason I can see other than the fact that the Nikkei closed down a whopping 12%.  While the Japanese certainly have good reasons for selling off their market, I'm afraid I just don't get the connection that much to the US market.  The NQ and YM are down by almost as much as ES.  It's looking to me like a massive panic type reaction and that's never good.

The only hope I can see right now is that the futures sell-off seems to have stopped around midnight at the 1259 level in the ES, which is the January support.  ES has now bounced back to 1270.  If this trend can continue, today's candle will be a classic hammer and that is a powerful reversal signal.  Assuming technicals still mean anything anymore.

If not, the next support levels are 1260, 1250, 1235, and 1215.  Below that, 1192 and 1174.  Oil is back below $100 but the oil/market correlation seems to be changing again.  Whereas we've been in an inverse correlation, lately oil is trading with the market.  I'm not sure oil is leading the market right now.

The VIX meanwhile was rejected by its 200 day MA once again and put in a dark cloud cover.  I really hate to sound like one of these people who keep calling for something to happen because eventually you're going to be right, but I don't see how the market can go much lower without the VIX heading higher.

However, with all the turmoil going on right now in the world, and so much stuff not making sense to me I'm going to have to take a break.  I have no clue where this market is going to go and I'm not even going to try.  All I'll do is turn the swing trend arrow to red and call it a day.  Maybe tomorrow will provide some clarity.

Trades

Today I bought 100 shares of Ford (F) at 14.31; it closed at 14.29.  My OMEX trade at least did gain a bit today, closing up 6.45%.  There should be a lot more buying opportunities when the bottom gets put in.

Monday, March 14, 2011

At a crossroads

Last week featured some pretty volatile action in the Dow, including that awful Thursday dump. Tonight I want to put up the weekly YM Dow futures chart. You can see that we are now at a crossroads.

The RTC


We're sitting right now at the bottom edge of the rising regression trend channel that goes back to the end of August. This point is literally at the crossroads of a second descending RTC going back to February 21st.

The last time we were in such a situation was the last week of last November. Not only does the chart look similar, but the indicators are all in the same position as they were back then. That time, the decline was halted right around the same relative spot we find ourselves in now. Any further decline from here would make me short term bearish.

The VIX

So which is it? The VIX hit its upper weekly Bollinger band last week. Then it took a big fall on Friday after hitting its 200 day MA. The VIX always has trouble breaking above both of those. In addition, the VIX fell further on Friday proportionally than the Dow rose. My guess is that this was due to the terrible situation in Japan. It's difficult to get accurate news on the true situation there, but from what I can find out, it looks like, as bad as it is (and it is certainly a horrible tragedy) it's still not the actual end of the entire world just yet. It looks to me that the VIX has room to go lower this coming week and few incentives technically to go higher, implying higher stock prices.

Oil

Oil definitely put in at least a short term top on March 7th and has been declining ever since. The impact of the earthquake on oil isn't entirely clear, though my guess is that demand in Japan will fall at least until the damage to the infrastructure is repaired. And indeed oil in the overnight is headed lower right now and holding under $100 a barrel. Lower oil also implies higher stocks these days.

Futures

The Big Three (ES, NQ, and YM) are all negative right now (1:15 AM EDT) by just over a third of a percent. However, most of that came from a gap down at the open. The evening chart bottomed around 6:35 PM and has been rising since then. Also, they have now broken above their respective daily pivots, a bullish sign. And Friday's candles of both ES and YM look like hammers to me, a further bullish sign.

History

We are about to enter what The Stock Traders Almanac calls the "sweet spot" of March, historically the strongest period of the month. The Dow has gone up in 17 of the last 23 years on the Monday of triple witching. So history is on our side for tomorrow.

Numbers to watch tomorrow

12,056: The Dow's daily pivot on Friday. Breaking over this was bullish. That number now becomes support.  Watch the action around tomorrow's daily pivot.  That will be the key to the rest of the day.

12,000: The psychological support. Don't underestimate the importance of this round number. It has held off no fewer than three bearish assaults in the last 30 days.

12,060:
What was support at the end of February is now resistance. Breaking above this would be bullish. We're only 16 points from there right now.

The play at the plate

Summing up all of the above observations, I see a lot of short term bullish factors, some decent support, and a lack of selling pressure. The fact that the world has had a whole weekend to assess the situation in Japan is helpful to the market too. And interestingly, although there was the usual finally 30 minute dip on Friday afternoon as the day traders headed out the door, there was not a wide scale panic for the exits.

So all in all, I'm actually expecting the market to end at least a bit higher tomorrow.