Yesterday I was fairly sure we were going higher today, but I didn't really think we'd see the monster 178 point pop we got in the Dow. But I'll still take it :-) So there's a bunch of interesting stuff going on in today's daily Dow chart. Check it out.
First of all, we reclaimed the 12,000 mark and crossed back up over the 40 day MA (at 11,989). Even more importantly, I think, is that we crossed up above the daily pivot at 11,854 and held. All of these points are bullish. In fact, today's intraday chart looked like a mirror image of the awful action last week. 90% of the entire day's action was over in the first two minutes of trading, only this time it was to the upside.
Notice also how the RTC works. Look at the steep descending RTC. Yesterday we broke out the right edge of that. That was the bullish setup. Todays gain was the confirming bullish trigger.However, look at the volume - much lower than yesterday.
Next, take a look at the Fibonacci retracement levels I've drawn in going from the high on February 18th to the low last week. I've never been a huge fan of Fibonacci because I don't really understand why it should work, but it sure seems to. Notice how today's high, 12,078, almost exactly hit the 0.618 Fibonacci retracement level. That's going to be an important number to watch tomorrow.
Then there's our friend the VIX. It gapped down in a big way today, down nearly 16% to close at 20.61. In so doing, it fell right through both its 200 day MA and its daily pivot. It is now back in the middle of its Bollinger band range, and the area where it has spent much of the last month. It definitely still has room to go lower.
Moving on to the futures, all three of ES, NQ, and YM are down at the moment (1:20 AM EDT) by about a quarter of a percent.
And finally there's the news, or rather the lack thereof. On this evening's news wire, I note that neither Libya nor Japan appear in the top stories on the wire at this hour.
So let's wrap it up. On the plus side, we have positive chart action that broke through important resistance levels, a bullish trigger from the RTC, positive VIX action (positive for stocks, that is), and positive "no news is good news" action on the international front.
On the minus side we have slightly negative action from the futures and declining volume. My net take on this is that after such a large three day run, and the big move up today, the market may take a breather tomorrow. It now has support at 12,000 and resistance at 12,049. So I'm looking for a small range day tomorrow, with resumed upside later on this week.
Trades
Last Thursday and Friday, I took advantage of the sale the market threw to pick up a little more OMEX, ARR, and CIM. Those all proved to be good moves. In a stupid move, I bought some Citibank (C) at 4.53. It closed today at 4.43 after news of the upcoming reverse split.
I don't normally mention my IRA here, but I also bought some O (Realty Income Corp) at 31.72 as a longer term investment there.
Tuesday, March 22, 2011
Sunday, March 20, 2011
Threading the needle
Lately, it seems as if we're walking through a veritable market minefield of various catastrophes and calamities, any one of which has the potential to send the market bus careening off a cliff.
The latest one is the bizarre new Mideast war on Libya. We are told that the object is not to get rid of Col. Khadaffi. This is sort of like Babe Ruth stepping up to the plate and instead of pointing to a spot out in left field, he announces that the object isn't to win the game, he's just there to play some ball. I'm just wondering, if the object isn't to get rid of the esteemed dictator, then what the heck's going on? The current course of dropping bombs on antiaircraft guns looks like all it will do is prolong an already uncertain civil war. As far as I'm concerned, either go long or go home.
And as far as I can tell, the opposition consists largely of young guys riding around in beat up Toyota pickups and shooting their AK's into the air. They don't inspire a whole lot of confidence in a quick and decisive victory.
On the positive side, it appears that the Japanese have successfully averted nuclear Armageddon by reconnecting their reactors to electric power. From what I read, if it can be believed, reactors nos. 1 and 2 are now reconnected and doing OK, nos. 5 and 6 have been successfully shut down, and only nos. 3 and 4 are still in question. In any case, this catastrophe seems to be rapidly falling over the event horizon as it is not the headline story in any of the news sites I've visited this weekend.
So given all this uncertainty, the only indicator we have as of Sunday evening for where we might be headed tomorrow is the futures. And somewhat to my surprise it's actually not looking too bad right now (8:30 PM EDT). All three futures are up about a third of a percent. Given this and the considerable retreat of the VIX last Friday from extremely overbought readings, I am right now cautiously optimistic for stocks tomorrow. This of course assumes that Col. K. doesn't do something stupid like setting all of his oil wells on fire or something.
In any case, the Dow chart above shows that we have exited the descending RTC channel and that in itself is a bullish trigger. Also, note how all of the indicators have hooked upward from highly oversold levels. Also bullish.
Performance
It's been a rough month for me. I am actually down four weeks in a row now, something that hasn't happened since I can't remember when. Minus 0.17%, 1.32%, 1.36%, and last week 1.68%. Ouch! However, these are unrealized losses and I'm still up 3.47% year to date, compared to the Dow's 2.42%. I've been hampered in my ability to play the short side on a swing basis because of all of the volatility in the market. When 90% of the day's movement happens in the first minute of trading, it's kind of tough to capitalize on it.
The latest one is the bizarre new Mideast war on Libya. We are told that the object is not to get rid of Col. Khadaffi. This is sort of like Babe Ruth stepping up to the plate and instead of pointing to a spot out in left field, he announces that the object isn't to win the game, he's just there to play some ball. I'm just wondering, if the object isn't to get rid of the esteemed dictator, then what the heck's going on? The current course of dropping bombs on antiaircraft guns looks like all it will do is prolong an already uncertain civil war. As far as I'm concerned, either go long or go home.
And as far as I can tell, the opposition consists largely of young guys riding around in beat up Toyota pickups and shooting their AK's into the air. They don't inspire a whole lot of confidence in a quick and decisive victory.
On the positive side, it appears that the Japanese have successfully averted nuclear Armageddon by reconnecting their reactors to electric power. From what I read, if it can be believed, reactors nos. 1 and 2 are now reconnected and doing OK, nos. 5 and 6 have been successfully shut down, and only nos. 3 and 4 are still in question. In any case, this catastrophe seems to be rapidly falling over the event horizon as it is not the headline story in any of the news sites I've visited this weekend.
So given all this uncertainty, the only indicator we have as of Sunday evening for where we might be headed tomorrow is the futures. And somewhat to my surprise it's actually not looking too bad right now (8:30 PM EDT). All three futures are up about a third of a percent. Given this and the considerable retreat of the VIX last Friday from extremely overbought readings, I am right now cautiously optimistic for stocks tomorrow. This of course assumes that Col. K. doesn't do something stupid like setting all of his oil wells on fire or something.
In any case, the Dow chart above shows that we have exited the descending RTC channel and that in itself is a bullish trigger. Also, note how all of the indicators have hooked upward from highly oversold levels. Also bullish.
Performance
It's been a rough month for me. I am actually down four weeks in a row now, something that hasn't happened since I can't remember when. Minus 0.17%, 1.32%, 1.36%, and last week 1.68%. Ouch! However, these are unrealized losses and I'm still up 3.47% year to date, compared to the Dow's 2.42%. I've been hampered in my ability to play the short side on a swing basis because of all of the volatility in the market. When 90% of the day's movement happens in the first minute of trading, it's kind of tough to capitalize on it.
Friday, March 18, 2011
The reversal, at last
The wearin' o' the green
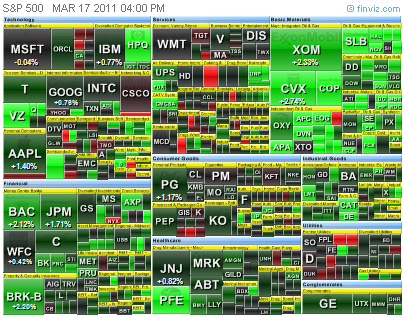
Just in time for St. Patrick's Day, today brought us a welcome sea of green (market heat map courtesy of finviz.com). There's also an important lesson here in having the courage of your convictions. After being wrong abut the reversal I just knew had to come, for two days in a row, by last night I just couldn't bring myself to call a bottom. I did mention though that every time I got the itch to throw in the towel and sell sell sell, that the market always reversed the next day.
And sure enough if that isn't exactly what happened today. That's the main reason I did not go short or sell everything yesterday. And now I'm so glad I didn't.
Futures
Moving on to the daily YM futures, we can see a classic parabolic swan dive ending with a big hammer (today's candle). Since it's now 1:40 AM, the rightmost candle is actually the overnight and look at how that's starting off. YM is up 0.81%. And ES is up even more - 0.87%.

This pop also takes us well above the right hand edge of the descending RTC established on March 9th. This is a bullish setup and there is only a 5% chance that this candle could be part of the downtrend. Today's G7 intervention in the yen and news of electric power becoming available to run the cooling pumps at the damaged reactors in Japan should help out stocks tomorrow. Like I said yesterday, it's the temperature in the reactors that's driving the market now.
Pivots
Further good news is that the Dow broke above its daily pivot today and never looked back. And the VIX broke under its own pivot with a big gap-down at the open. The only downside at the moment is that tomorrow is a triple witching day and that can lead to lots of volatility.
It's too soon to say if today's gain was just a relief rally of the end of the recent downtrend. We need to see how next Monday plays out for that. At least unless some reactor vaporizes in a mushroom cloud tomorrow, I don't see much chance of another huge down day tomorrow like we've seen the past few days.
A political aside
The only other thing worth watching is our old friend oil. It's been drifting higher in the overnight. However, we seem to be back in a positive correlation between oil and the market, so that's not necessarily a bad sign. Hopefully we can look for some more stability in the Middle East because Col. Khadaffi seems to be on the verge of retaking control of Libya.
I can't say that I'm a big fan of Khadaffi, the man who sent one of his agents to bring down a Pan Am 747 in 1988, but I have no particular sympathy for his opponents either. I have no doubt that they are the same people who were cheering and dancing in the streets upon said agent's disgusting return to Libya in 2009 as some sort of national hero after being released by the craven Scots on "medical grounds", and where he underwent a miraculous recovery from his supposedly terminal condition.
I don't think it's as important who runs Libya as long as they stop fighting. Assuming the UN continues sitting on its hands over the proposed no-fly zone and President Nerobama continues fiddling with his basketball brackets while the world burns, Khadaffi might have the time he needs to get back in the driver's seat over there.
Trades
No trades today but with the VIX back under 30, I'm back from my short vacation. I stuck with my Ford play through its dip yesterday. OMEX meanwhile seems to be diving like its Zeus underwater robot. It's nearing some longer term support around today's close of 2.33 so I'll just keep watching it.
Just in time for St. Patrick's Day, today brought us a welcome sea of green (market heat map courtesy of finviz.com). There's also an important lesson here in having the courage of your convictions. After being wrong abut the reversal I just knew had to come, for two days in a row, by last night I just couldn't bring myself to call a bottom. I did mention though that every time I got the itch to throw in the towel and sell sell sell, that the market always reversed the next day.And sure enough if that isn't exactly what happened today. That's the main reason I did not go short or sell everything yesterday. And now I'm so glad I didn't.
Futures
Moving on to the daily YM futures, we can see a classic parabolic swan dive ending with a big hammer (today's candle). Since it's now 1:40 AM, the rightmost candle is actually the overnight and look at how that's starting off. YM is up 0.81%. And ES is up even more - 0.87%.

This pop also takes us well above the right hand edge of the descending RTC established on March 9th. This is a bullish setup and there is only a 5% chance that this candle could be part of the downtrend. Today's G7 intervention in the yen and news of electric power becoming available to run the cooling pumps at the damaged reactors in Japan should help out stocks tomorrow. Like I said yesterday, it's the temperature in the reactors that's driving the market now.
Pivots
Further good news is that the Dow broke above its daily pivot today and never looked back. And the VIX broke under its own pivot with a big gap-down at the open. The only downside at the moment is that tomorrow is a triple witching day and that can lead to lots of volatility.
It's too soon to say if today's gain was just a relief rally of the end of the recent downtrend. We need to see how next Monday plays out for that. At least unless some reactor vaporizes in a mushroom cloud tomorrow, I don't see much chance of another huge down day tomorrow like we've seen the past few days.
A political aside
The only other thing worth watching is our old friend oil. It's been drifting higher in the overnight. However, we seem to be back in a positive correlation between oil and the market, so that's not necessarily a bad sign. Hopefully we can look for some more stability in the Middle East because Col. Khadaffi seems to be on the verge of retaking control of Libya.
I can't say that I'm a big fan of Khadaffi, the man who sent one of his agents to bring down a Pan Am 747 in 1988, but I have no particular sympathy for his opponents either. I have no doubt that they are the same people who were cheering and dancing in the streets upon said agent's disgusting return to Libya in 2009 as some sort of national hero after being released by the craven Scots on "medical grounds", and where he underwent a miraculous recovery from his supposedly terminal condition.
I don't think it's as important who runs Libya as long as they stop fighting. Assuming the UN continues sitting on its hands over the proposed no-fly zone and President Nerobama continues fiddling with his basketball brackets while the world burns, Khadaffi might have the time he needs to get back in the driver's seat over there.
Trades
No trades today but with the VIX back under 30, I'm back from my short vacation. I stuck with my Ford play through its dip yesterday. OMEX meanwhile seems to be diving like its Zeus underwater robot. It's nearing some longer term support around today's close of 2.33 so I'll just keep watching it.
Thursday, March 17, 2011
OK, I finally got it
No need to put up any charts tonight. I may be a bit slow, but I think I have it figured out, finally. The market is now 100% driven only by the temperature in Japan's nuclear reactor cores. Temperature up, market down. Simple as that. Nothing else matters anymore. Earnings, yield, sales, supply and demand, forget it. The entire fate of the global financial system now hinges solely on three overheated reactors. halfway around the world.
If there's yet another news report of "another meltdown" tomorrow morning, whether it's true or not, look for another 300 point drop in the Dow. When the reactors are all finally secured, and one has to believe they eventually will be, then the market will go back up.
I'm not even going to bother pointing out any of the positive technical signs I see right now. Three times bitten, four times shy. But I'm also definitely not throwing in the towel either. Every single time I've done this in the past, the market was up big time the very next day. I'm not falling for that one again.
And whenever the VIX hits 30, I always go on vacation. That's one of my rules. I'll be back when some semblance of sanity returns to the stock market. Life's too short to play this bizarre Kafkaesque game.
Good luck to all you traders out there and deepest sympathies to all the victims of the earthquake and tsunami.
If there's yet another news report of "another meltdown" tomorrow morning, whether it's true or not, look for another 300 point drop in the Dow. When the reactors are all finally secured, and one has to believe they eventually will be, then the market will go back up.
I'm not even going to bother pointing out any of the positive technical signs I see right now. Three times bitten, four times shy. But I'm also definitely not throwing in the towel either. Every single time I've done this in the past, the market was up big time the very next day. I'm not falling for that one again.
And whenever the VIX hits 30, I always go on vacation. That's one of my rules. I'll be back when some semblance of sanity returns to the stock market. Life's too short to play this bizarre Kafkaesque game.
Good luck to all you traders out there and deepest sympathies to all the victims of the earthquake and tsunami.
Wednesday, March 16, 2011
Finally some clarity?
Today sure felt like a washout low, featuring an incredible nearly 300 point dive right off the open, followed by a fairly steady retracement the rest of the day. The net result was a pretty decent hammer candle, similar to yesterday's only much larger.
I don't know it this "double hammer" is even an official pattern, but it's pretty unusual. I went over the last 10 years of daily Dow charts and only found four other instances of it. In all four cases, the following day was higher. And the fast stochastic has now done a bullish crossover - that's always a good indicator.
In addition, this evening (at 1:30 AM EDT) the ES and NQ are actually up for a change, +0.14% and 0.11% respectively. And as I write, the YM just turned positive too. And even the Nikkei is up by over 3.5% now.
Also, the VIX today executed a pretty amazing pattern of its own today, putting in a huge gap up hanging man that broke way above the upper Bollinger band. I looked at the daily VIX back to 2003 and only found four other instances of something like this. In three of the four, the VIX fell the next day. In the fourth case, it fell a day later.
Now I know that what few readers I might still have left are probably shaking their heads by this point, because I've said it a couple of times already and been very very wrong but by gosh, it sure looks to me like we're headed higher tomorrow.
Trades
No trades today, but speaking of going higher, check out this textbook chart. This is Ford. Three important things happened together here today:
first it broke back above its 200 day MA in a convincing manner, always a bullish sign,
second, it broke up over its descending regression trend channel, a bullish setup,
and third, it put in a huge bullish engulfing pattern that not only spanned yesterday's range, but the five days before that too.
I'm about as certain as I can get this one is going higher. Disclaimer: I'm long F and not planning on selling anytime soon.
I don't know it this "double hammer" is even an official pattern, but it's pretty unusual. I went over the last 10 years of daily Dow charts and only found four other instances of it. In all four cases, the following day was higher. And the fast stochastic has now done a bullish crossover - that's always a good indicator.
In addition, this evening (at 1:30 AM EDT) the ES and NQ are actually up for a change, +0.14% and 0.11% respectively. And as I write, the YM just turned positive too. And even the Nikkei is up by over 3.5% now.
Also, the VIX today executed a pretty amazing pattern of its own today, putting in a huge gap up hanging man that broke way above the upper Bollinger band. I looked at the daily VIX back to 2003 and only found four other instances of something like this. In three of the four, the VIX fell the next day. In the fourth case, it fell a day later.
Now I know that what few readers I might still have left are probably shaking their heads by this point, because I've said it a couple of times already and been very very wrong but by gosh, it sure looks to me like we're headed higher tomorrow.
Trades
No trades today, but speaking of going higher, check out this textbook chart. This is Ford. Three important things happened together here today:first it broke back above its 200 day MA in a convincing manner, always a bullish sign,
second, it broke up over its descending regression trend channel, a bullish setup,
and third, it put in a huge bullish engulfing pattern that not only spanned yesterday's range, but the five days before that too.
I'm about as certain as I can get this one is going higher. Disclaimer: I'm long F and not planning on selling anytime soon.
Tuesday, March 15, 2011
Just plain wrong
Wow, was I ever wrong about today. All the signs seemed to be lining up for an advance, and yet we ended up with a 51 point drop in the Dow. On top of that, as of right now (1:15 AM EDT) we are staring at an appalling 2.08% decline in the ES futures, for no reason I can see other than the fact that the Nikkei closed down a whopping 12%. While the Japanese certainly have good reasons for selling off their market, I'm afraid I just don't get the connection that much to the US market. The NQ and YM are down by almost as much as ES. It's looking to me like a massive panic type reaction and that's never good.
The only hope I can see right now is that the futures sell-off seems to have stopped around midnight at the 1259 level in the ES, which is the January support. ES has now bounced back to 1270. If this trend can continue, today's candle will be a classic hammer and that is a powerful reversal signal. Assuming technicals still mean anything anymore.
If not, the next support levels are 1260, 1250, 1235, and 1215. Below that, 1192 and 1174. Oil is back below $100 but the oil/market correlation seems to be changing again. Whereas we've been in an inverse correlation, lately oil is trading with the market. I'm not sure oil is leading the market right now.
The VIX meanwhile was rejected by its 200 day MA once again and put in a dark cloud cover. I really hate to sound like one of these people who keep calling for something to happen because eventually you're going to be right, but I don't see how the market can go much lower without the VIX heading higher.
However, with all the turmoil going on right now in the world, and so much stuff not making sense to me I'm going to have to take a break. I have no clue where this market is going to go and I'm not even going to try. All I'll do is turn the swing trend arrow to red and call it a day. Maybe tomorrow will provide some clarity.
Trades
Today I bought 100 shares of Ford (F) at 14.31; it closed at 14.29. My OMEX trade at least did gain a bit today, closing up 6.45%. There should be a lot more buying opportunities when the bottom gets put in.
The only hope I can see right now is that the futures sell-off seems to have stopped around midnight at the 1259 level in the ES, which is the January support. ES has now bounced back to 1270. If this trend can continue, today's candle will be a classic hammer and that is a powerful reversal signal. Assuming technicals still mean anything anymore.
If not, the next support levels are 1260, 1250, 1235, and 1215. Below that, 1192 and 1174. Oil is back below $100 but the oil/market correlation seems to be changing again. Whereas we've been in an inverse correlation, lately oil is trading with the market. I'm not sure oil is leading the market right now.
The VIX meanwhile was rejected by its 200 day MA once again and put in a dark cloud cover. I really hate to sound like one of these people who keep calling for something to happen because eventually you're going to be right, but I don't see how the market can go much lower without the VIX heading higher.
However, with all the turmoil going on right now in the world, and so much stuff not making sense to me I'm going to have to take a break. I have no clue where this market is going to go and I'm not even going to try. All I'll do is turn the swing trend arrow to red and call it a day. Maybe tomorrow will provide some clarity.
Trades
Today I bought 100 shares of Ford (F) at 14.31; it closed at 14.29. My OMEX trade at least did gain a bit today, closing up 6.45%. There should be a lot more buying opportunities when the bottom gets put in.
Monday, March 14, 2011
At a crossroads
Last week featured some pretty volatile action in the Dow, including that awful Thursday dump. Tonight I want to put up the weekly YM Dow futures chart. You can see that we are now at a crossroads.
The RTC
We're sitting right now at the bottom edge of the rising regression trend channel that goes back to the end of August. This point is literally at the crossroads of a second descending RTC going back to February 21st.
The last time we were in such a situation was the last week of last November. Not only does the chart look similar, but the indicators are all in the same position as they were back then. That time, the decline was halted right around the same relative spot we find ourselves in now. Any further decline from here would make me short term bearish.
The VIX
So which is it? The VIX hit its upper weekly Bollinger band last week. Then it took a big fall on Friday after hitting its 200 day MA. The VIX always has trouble breaking above both of those. In addition, the VIX fell further on Friday proportionally than the Dow rose. My guess is that this was due to the terrible situation in Japan. It's difficult to get accurate news on the true situation there, but from what I can find out, it looks like, as bad as it is (and it is certainly a horrible tragedy) it's still not the actual end of the entire world just yet. It looks to me that the VIX has room to go lower this coming week and few incentives technically to go higher, implying higher stock prices.
Oil
Oil definitely put in at least a short term top on March 7th and has been declining ever since. The impact of the earthquake on oil isn't entirely clear, though my guess is that demand in Japan will fall at least until the damage to the infrastructure is repaired. And indeed oil in the overnight is headed lower right now and holding under $100 a barrel. Lower oil also implies higher stocks these days.
Futures
The Big Three (ES, NQ, and YM) are all negative right now (1:15 AM EDT) by just over a third of a percent. However, most of that came from a gap down at the open. The evening chart bottomed around 6:35 PM and has been rising since then. Also, they have now broken above their respective daily pivots, a bullish sign. And Friday's candles of both ES and YM look like hammers to me, a further bullish sign.
History
We are about to enter what The Stock Traders Almanac calls the "sweet spot" of March, historically the strongest period of the month. The Dow has gone up in 17 of the last 23 years on the Monday of triple witching. So history is on our side for tomorrow.
Numbers to watch tomorrow
12,056: The Dow's daily pivot on Friday. Breaking over this was bullish. That number now becomes support. Watch the action around tomorrow's daily pivot. That will be the key to the rest of the day.
12,000: The psychological support. Don't underestimate the importance of this round number. It has held off no fewer than three bearish assaults in the last 30 days.
12,060: What was support at the end of February is now resistance. Breaking above this would be bullish. We're only 16 points from there right now.
The play at the plate
Summing up all of the above observations, I see a lot of short term bullish factors, some decent support, and a lack of selling pressure. The fact that the world has had a whole weekend to assess the situation in Japan is helpful to the market too. And interestingly, although there was the usual finally 30 minute dip on Friday afternoon as the day traders headed out the door, there was not a wide scale panic for the exits.
So all in all, I'm actually expecting the market to end at least a bit higher tomorrow.
The RTC
We're sitting right now at the bottom edge of the rising regression trend channel that goes back to the end of August. This point is literally at the crossroads of a second descending RTC going back to February 21st.
The last time we were in such a situation was the last week of last November. Not only does the chart look similar, but the indicators are all in the same position as they were back then. That time, the decline was halted right around the same relative spot we find ourselves in now. Any further decline from here would make me short term bearish.
The VIX
So which is it? The VIX hit its upper weekly Bollinger band last week. Then it took a big fall on Friday after hitting its 200 day MA. The VIX always has trouble breaking above both of those. In addition, the VIX fell further on Friday proportionally than the Dow rose. My guess is that this was due to the terrible situation in Japan. It's difficult to get accurate news on the true situation there, but from what I can find out, it looks like, as bad as it is (and it is certainly a horrible tragedy) it's still not the actual end of the entire world just yet. It looks to me that the VIX has room to go lower this coming week and few incentives technically to go higher, implying higher stock prices.
Oil
Oil definitely put in at least a short term top on March 7th and has been declining ever since. The impact of the earthquake on oil isn't entirely clear, though my guess is that demand in Japan will fall at least until the damage to the infrastructure is repaired. And indeed oil in the overnight is headed lower right now and holding under $100 a barrel. Lower oil also implies higher stocks these days.
Futures
The Big Three (ES, NQ, and YM) are all negative right now (1:15 AM EDT) by just over a third of a percent. However, most of that came from a gap down at the open. The evening chart bottomed around 6:35 PM and has been rising since then. Also, they have now broken above their respective daily pivots, a bullish sign. And Friday's candles of both ES and YM look like hammers to me, a further bullish sign.
History
We are about to enter what The Stock Traders Almanac calls the "sweet spot" of March, historically the strongest period of the month. The Dow has gone up in 17 of the last 23 years on the Monday of triple witching. So history is on our side for tomorrow.
Numbers to watch tomorrow
12,056: The Dow's daily pivot on Friday. Breaking over this was bullish. That number now becomes support. Watch the action around tomorrow's daily pivot. That will be the key to the rest of the day.
12,000: The psychological support. Don't underestimate the importance of this round number. It has held off no fewer than three bearish assaults in the last 30 days.
12,060: What was support at the end of February is now resistance. Breaking above this would be bullish. We're only 16 points from there right now.
The play at the plate
Summing up all of the above observations, I see a lot of short term bullish factors, some decent support, and a lack of selling pressure. The fact that the world has had a whole weekend to assess the situation in Japan is helpful to the market too. And interestingly, although there was the usual finally 30 minute dip on Friday afternoon as the day traders headed out the door, there was not a wide scale panic for the exits.
So all in all, I'm actually expecting the market to end at least a bit higher tomorrow.
Friday, March 11, 2011
The triangle resolved
Two days ago I wrote about the symmetrical triangle pattern we were seeing:
So anyway, the triangle is now resolved and we have now broken below the center of the ascending regression trend channel that goes back to last June (though we still have not broken below it yet, even after today's horrible 228 point dive).
I'm showing the weekly chart here so you can see for yourself. The current situation has happened twice since last June. Once in the first three weeks of last November and before that in the middle of last August. And the distance between each of these was about the same amount of time: 10 weeks from August to November and then 12 weeks from November to the present.
The look of this pattern, plus the look of the weekly stochastic suggests to me that this is not in fact the start of the next Great Depression. That said, I'm not looking for much improvement tomorrow. The futures are all down at ;east half a percent again this evening (1:30 AM EST) and there's more bad economic news out of China, this time about inflation (though it's not clear to me how much one can trust anything the Chinese say). Also, the last two times we broke under the center of the long term RTC, it took about a week to recover.
And even though the VIX finally moved out of the center of its recent range today, it still has more room to go higher tomorrow. It closed at 21.88 today and the upper Bollinger band is at 23.17. The only thing in the way is its 200 day MA at 21.92. That might be key, since five of the last six times the VIX approached the 200 MA from below, it was rejected. The one exception was last May when the whole PIGS/the world is ending thing broke.
If the VIX cannot advance tomorrow, that would suggest that any further market declines will be limited. On the other hand, we did break the 12K support level and the S&P broke it 1300 support today. However, the point we closed at today, 11,985 is in fact another support level from the last week of January. Also, note that we are now further from the daily pivot (at 12,209) than we've been at any time since last December 1st. And we also hit the lower Bollinger band in the Dow today too
However, I'm still not going to put up the red swing trend arrow because even a massive one day drop does not constitute a trend, and the action up til now was anything but a trend. I even tried fitting a regression to the recent action but the Pearson coefficient was too low to be meaningful.
I will say that I just hate this sort of market. 90% of the carnage was over in the first two minutes of trading this morning. And even as of late last night it wasn't at all clear that we were in for this so there was no real way to prepare for it. I though we might go lower, but like the Spanish Inquisition, I wasn't expecting this. I simply don't know how to make money in an environment like this. My only consolation at this point is that I have a lot of cash on the sidelines and I'm ready to go shopping when the all-clear sounds.
Bottom line, look for a small range day tomorrow with limited downside. Watch what the VIX does around that 200 MA - that will be the key to tomorrow.
"These triangle patterns are like springs that get compressed more and more as the days go by. When they pop, they can go big."Well this one blew up today, big time. Unfortunately, it went in the opposite direction I thought it would. I knew that these patterns tend to exit in the same direction as they entered. My mistake was in assuming the entry was from the longer term uptrend you can follow from the left edge of this daily Dow chart. However, the triangle wasn't really fully established until March 3rd, and a triangle there comes in from below.
So anyway, the triangle is now resolved and we have now broken below the center of the ascending regression trend channel that goes back to last June (though we still have not broken below it yet, even after today's horrible 228 point dive).
I'm showing the weekly chart here so you can see for yourself. The current situation has happened twice since last June. Once in the first three weeks of last November and before that in the middle of last August. And the distance between each of these was about the same amount of time: 10 weeks from August to November and then 12 weeks from November to the present.
The look of this pattern, plus the look of the weekly stochastic suggests to me that this is not in fact the start of the next Great Depression. That said, I'm not looking for much improvement tomorrow. The futures are all down at ;east half a percent again this evening (1:30 AM EST) and there's more bad economic news out of China, this time about inflation (though it's not clear to me how much one can trust anything the Chinese say). Also, the last two times we broke under the center of the long term RTC, it took about a week to recover.
And even though the VIX finally moved out of the center of its recent range today, it still has more room to go higher tomorrow. It closed at 21.88 today and the upper Bollinger band is at 23.17. The only thing in the way is its 200 day MA at 21.92. That might be key, since five of the last six times the VIX approached the 200 MA from below, it was rejected. The one exception was last May when the whole PIGS/the world is ending thing broke.
If the VIX cannot advance tomorrow, that would suggest that any further market declines will be limited. On the other hand, we did break the 12K support level and the S&P broke it 1300 support today. However, the point we closed at today, 11,985 is in fact another support level from the last week of January. Also, note that we are now further from the daily pivot (at 12,209) than we've been at any time since last December 1st. And we also hit the lower Bollinger band in the Dow today too
However, I'm still not going to put up the red swing trend arrow because even a massive one day drop does not constitute a trend, and the action up til now was anything but a trend. I even tried fitting a regression to the recent action but the Pearson coefficient was too low to be meaningful.
I will say that I just hate this sort of market. 90% of the carnage was over in the first two minutes of trading this morning. And even as of late last night it wasn't at all clear that we were in for this so there was no real way to prepare for it. I though we might go lower, but like the Spanish Inquisition, I wasn't expecting this. I simply don't know how to make money in an environment like this. My only consolation at this point is that I have a lot of cash on the sidelines and I'm ready to go shopping when the all-clear sounds.
Bottom line, look for a small range day tomorrow with limited downside. Watch what the VIX does around that 200 MA - that will be the key to tomorrow.
Thursday, March 10, 2011
Squeezing the triangle
Today the Dow put in a classic doji ending just about where it began but not until after a real sawtooth of an intraday chart featuring no fewer than seven distinct tops and bottoms. This is not inconsistent with the developing triangle pattern we're seeing. However, since oil is still the King, we take a look at that daily chart for a clue as to where the market may go tomorrow. The indicators are now all at levels about as oversold as they ever get. Not only that they have peaked and started to roll over.
Of particular interest is that oil has had two consecutive down days, something it has not seen since the middle of last month. And today's loss brought it out of the rising regression trend channel that begain on March 11st. That is a bearish trigger for oil. It has mostly been meandering around in the overnight so far, though in the last few minutes (just before 1:30 AM EST) it suddenly rose. However, I see no particular reasoon for this on the news wire, so that just may be one of those "who knows" things.
On the other hand, the futures have been guiding down all evening and are all down by about half a percent right now, a number that is definitely non-trivial. There's again no guidance from the VIX which remains stuck in no-man's land. There is some news out tonight about Chinese exports, but how and if that affects stocks tomorrow is anybody's guess.
In fact, that about sums it up - I have no idea where the market is going tomorrow. The inverse oil/market relationship suggests stocks may go higher, but the futures are pointing lower. And given that we're near the top of the recent trading range, that alone might be cause to imagine we're going lower tomorrow. But there's really just no clear direction tonight.
About the only thing I can think of is to watch the daily pivot which was12,179 today. Tomorrow it should be a bit higher. Watch for a break under that - that would be bearish.
No trades today. My OMEX trade from yesterday returned all of one penny to me today, but I'm still liking its daily chart. We'll let this one cook a while longer.
Of particular interest is that oil has had two consecutive down days, something it has not seen since the middle of last month. And today's loss brought it out of the rising regression trend channel that begain on March 11st. That is a bearish trigger for oil. It has mostly been meandering around in the overnight so far, though in the last few minutes (just before 1:30 AM EST) it suddenly rose. However, I see no particular reasoon for this on the news wire, so that just may be one of those "who knows" things.
On the other hand, the futures have been guiding down all evening and are all down by about half a percent right now, a number that is definitely non-trivial. There's again no guidance from the VIX which remains stuck in no-man's land. There is some news out tonight about Chinese exports, but how and if that affects stocks tomorrow is anybody's guess.
In fact, that about sums it up - I have no idea where the market is going tomorrow. The inverse oil/market relationship suggests stocks may go higher, but the futures are pointing lower. And given that we're near the top of the recent trading range, that alone might be cause to imagine we're going lower tomorrow. But there's really just no clear direction tonight.
About the only thing I can think of is to watch the daily pivot which was12,179 today. Tomorrow it should be a bit higher. Watch for a break under that - that would be bearish.
No trades today. My OMEX trade from yesterday returned all of one penny to me today, but I'm still liking its daily chart. We'll let this one cook a while longer.
Wednesday, March 9, 2011
Coiling the spring
Sometimes you're wrong, sometimes you're right. Today I was very right. Last night King Oil told me to put on my long hat and today the Dow rose 124 points. The central line of the rising regression trend channel held up nicely too.
And I noticed something interesting today. It looks to me like the Dow is now forming a symmetrical triangle pattern. I've drawn in the other leg of the triangle in this daily Dow chart. If this holds true, then tomorrow we should see a narrower range than today and bounded by both of these lines. It looks like this triangle should resolve itself within the next four days. We'll be watching for increased volume. When the breakout comes, it could be dramatic.
These triangle patterns are like springs that get compressed more and more as the days go by. When they pop, they can go big. And since the breakout is most often in the direction of the existing trend, and the existing trend going into this triangle was up, my bets are that we could see a big up day in the next few days.
Tonight, there's not much guidance from the VIX which today continued its indecisive trip up and down (as led by Puck no doubt) in the middle of its Bollinger band range. And the futures are all meandering pretty much nowhere themselves right now (at 1 AM EST), with all three being down just a hair.
The only real pointer for tomorrow's direction right now seems to come from oil. Oil futures have been in a declining channel all evening. And since we have been in an inverse oil/market correlation since the end of January, this implies higher stock prices tomorrow. But then we have this upper range limit right around today's close. And there's some significant oil-related economic news coming out tomorrow at 10 AM (crude inventories), so the day traders will want to be vigilant for that. All in all, I'd look for a smaller range day tomorrow than today, possibly starting off lower and ending around today's close or a tad higher. That's about all I got tonight.
Numbers to watch tomorrow
12,125: Today's daily pivot (tomorrow's not available yet). Today we crossed above this number and never looked back. More of the same is possible tomorrow.
This number is also the lower edge of the symmetrical triangle. I'd expect it to provide support tomorrow.
12,210: The upper edge of the symmetrical triangle. This number is close to last month's resistance area too and has proven to be tough to crack since we dropped below it on February 22nd.
12,125: The lower edge of the symmetrical triangle. I'd expect this number to provide support tomorrow.
Trades
Today, I bought a small amount of my favorite little spec play OMEX, Odyssey Marine, the Treasure Quest guys, at 2.67. It has pulled back a lot since its high last month and put in a doji on unusually high volume today.
And I noticed something interesting today. It looks to me like the Dow is now forming a symmetrical triangle pattern. I've drawn in the other leg of the triangle in this daily Dow chart. If this holds true, then tomorrow we should see a narrower range than today and bounded by both of these lines. It looks like this triangle should resolve itself within the next four days. We'll be watching for increased volume. When the breakout comes, it could be dramatic.
These triangle patterns are like springs that get compressed more and more as the days go by. When they pop, they can go big. And since the breakout is most often in the direction of the existing trend, and the existing trend going into this triangle was up, my bets are that we could see a big up day in the next few days.
Tonight, there's not much guidance from the VIX which today continued its indecisive trip up and down (as led by Puck no doubt) in the middle of its Bollinger band range. And the futures are all meandering pretty much nowhere themselves right now (at 1 AM EST), with all three being down just a hair.
The only real pointer for tomorrow's direction right now seems to come from oil. Oil futures have been in a declining channel all evening. And since we have been in an inverse oil/market correlation since the end of January, this implies higher stock prices tomorrow. But then we have this upper range limit right around today's close. And there's some significant oil-related economic news coming out tomorrow at 10 AM (crude inventories), so the day traders will want to be vigilant for that. All in all, I'd look for a smaller range day tomorrow than today, possibly starting off lower and ending around today's close or a tad higher. That's about all I got tonight.
Numbers to watch tomorrow
12,125: Today's daily pivot (tomorrow's not available yet). Today we crossed above this number and never looked back. More of the same is possible tomorrow.
This number is also the lower edge of the symmetrical triangle. I'd expect it to provide support tomorrow.
12,210: The upper edge of the symmetrical triangle. This number is close to last month's resistance area too and has proven to be tough to crack since we dropped below it on February 22nd.
12,125: The lower edge of the symmetrical triangle. I'd expect this number to provide support tomorrow.
Trades
Today, I bought a small amount of my favorite little spec play OMEX, Odyssey Marine, the Treasure Quest guys, at 2.67. It has pulled back a lot since its high last month and put in a doji on unusually high volume today.
Tuesday, March 8, 2011
Up and down
"Up and down, up and down,Puck, Midsummer Night's Dream, III, 2
I will lead them up and down"
Hah, you always thought that impish Puck was talking about Hermia and Lysander, right? Heck no, he was talking about the stock market! Just look at the daily Dow chart. From right to left, two days down, one day up, one day nowhere, one day down, two days up, etc., etc.
Even intraday today, up nicely at the open, then down over 100 points, then back up in the afternoon, then down again into the close. I was down almost 0.9% right after lunch, but managed to finish the day with a loss of just 0.17%.No rhyme or reason, just up and down, up and down. There is just one thing that makes sense here. Notice how the low of every single one of the last four sessions has bounced off the central line of the regression trend channel. OK, today it was the close, not the low, but we at least are seeing consistently higher lows since March 3rd. And oil was up again today. So that inverse relationship to the market is continuing, as I mentioned in my last post.
Whither oil?
And speaking of oil, while the oil futures continued higher today, I note that the XOI, the companies involved with oil, have put in two fairly large consecutive red candles, something that hasn't happened since last August. Oil itself went lower right after that back then. Also, this evening we have word that Kuwait, the UAE, and Nigeria may bump their output to offset the loss of Libyan oil.
The effect on crude futures was immediate and dramatic, to say the least. Just after midnight, or about an hour ago, the CL futures fell off a cliff. I've never put up a daily chart of CL in 5 minute bars before, but this one is worth looking at. Check it out.
In fact, in this one day chart, you can see that CL wasn't feeling too healthy most of the day. And we know what that means, right? That's right, oil down, stocks up tomorrow. Also, CL put in a gravestone doji in regular trading today, a bearish sign.The other indicators
Now let's check out the market futures. Right now (1:25 AM EST), ES is up nearly half a percent, the largest gain I've seen at the time of night in a while. NQ and YM are also up by almost as much. And they've been moving up pretty steadily all evening. This also looks bullish for tomorrow.
The only non-confirmation is from our friend the VIX, which remains firmly in Puck's grasp and is just bouncing up and down in the middle of its Bollinger band range. I know of no way to tell where it may be headed next. But the other signs tonight look pretty convincing to me.
It's not the start of a trend, but I think there's enough here to warrant reaching for the long hat for Tuesday.
One final note on oil
Much is being made right now about how the unrest in Libya could become a civil war that could last weeks or even months. Well, to me it already looks like a civil war, and it might last years. The big problem is Libya's geography. Rebels control the east, Khadaffi controls the west. In the middle is a vast expanse of nothing. Remember what happened the last time two armies decided to duke it out in northern Africa? Rommel and Montgomery spent the better part of 1941 and 42 chasing each other in and out of Libya.
So unless someone can get to the Infernal Colonel, this mess may go on for quite some time. I don't think oil is done going up just yet, but it looks like some of the speculators may be taking a few profits tomorrow before gearing up for the final push to the blow-off top that is surely coming in a few months.
Numbers to watch tomorrow
12,070: near-term support. A break under this would be bearish. I'm not expecting this.
12,120: this is tomorrow's RTC support level, the one that has been honored the last four sessions in a row.
12,173: the daily pivot. Climbing above this will be a bullish sign. Actually, that's today's pivot. Tomorrow's will be lower. I would not be surprised to see this level taken out early.
12,250: the mini-resistance level established last month.
12,000: the strong psychological support floor.
No trades today. I'm still waiting for the dust to settle.
What fools these mortals be!
Monday, March 7, 2011
Monday Outlook
This market is as hard to read as any I've seen in years. The only good thing I can find right now is that the uptrend that goes all the way back to last July is still completely intact, as you can see in this weekly Dow chart. And although we had some bad daily declines last week, overall the week ended with a small advance, and that came on higher volume than the big decline of the week before.That said, there's no guidance from the VIX right now which is hovering in the middle of its Bollinger band range. Oil, on the other hand shows no signs of retreat and as I showed in my last post, oil has been in an inverse correlation to the market since the end of January, and that correlation is getting more pronounced. I think a lot will hinge tomorrow on the market's reaction to the announcement this weekend about possibly releasing oil from the Strategic Petroleum Reserve. If that weakens oil, the market should react positively. And historically, we are entering the middle of March, which is the best part of the month historically.
But for the time being, all three futures are down (1 AM EST). ES and NQ are both down by just over a third of a percent, so that's not very encouraging. Beyond that, I admit I was wrong about last Friday and I don't have a real good feel for where we're going tomorrow.
Important numbers to watch for tomorrow
12,100, the center of the RTC. The low for the Dow on Friday was 12,079, exactly that same point on this rising line for that day. A break below this is bearish, above is bullish.
12,203, the Dow daily pivot. If we can get over this, then bullish. Hitting this level and reversing would be bearish.
12,250, the most recent resistance level in the Dow established last month.
And of course, 12,000 on the other end, the prime psychological support.
Performance
Although the Dow gained slightly last week, it was not a good week for me. I lost 1.32%. It was a week that just did not suit my style and my attempts to work around this only made it worse. However, the damage could have been worse I suppose and I'm still up 6.69% year-to-date, compared to the Dow's 5.11%. We'll see what this week brings.
Sunday, March 6, 2011
Does rising oil make the market fall?
OK, now that I've gotten my oil rant out of my system, it's time to take a more analytical look at the situation. I'm going to do the same thing I did with the VIX last month - look for correlations between the market and the price of oil. Does rising oil really make the market go down? Let's see. First of all, here's a chart of crude oil futures (the CL M1) in red, for the last 300 days, 12/18/09 through 3/4/11 alongside the Dow (in blue). The Dow values have been divided by 1000 to make them scale nicely. At first glance, it sure looks like there's actually a high positive correlation between the market and the price of oil. Oil up, market up, and vice versa.
Now let's do a cross covariance of oil and the Dow. Yup, pretty much what you'd expect from looking at the raw data. There is actually a strong positive correlation in the sample period between the price of oil and the price of the market. Here's the chart. Recall that the halfway point of the x-axis represents the point in time where both charts are completely lined up.Now let's do the same thing, but on just this past month of trading. Here are the last 20 days of the Dow vs. CL.
Whoa! Almost the exact opposite. Ignoring the slope of the curve for the moment, we see that what we have here is a high negative correlation: oil up, market down, and vice-versa. So sometimes oil and the market correlate but other times they don't. It might be useful to know when this flip-flop happens.So I ran the 20 day correlation in a loop, testing every 20 day (one trading month) period from 12/28/09 to today, and then plotted the result of each correlation, ie. how well oil and the market correlated for every 20 day period.
The results are interesting. We can see that over the course of the last year, oil and the markets have pretty much moved together, though by varying degrees.The greatest correlation came in the 20 day period beginning 4/30/10. After that, oil started to become generally less correlated with the market but at no time did it exhibit an inverse correlation (except for two dips just below zero). Until just under two months ago: January 21st of this year. After that, oil and the markets started moving in opposite directions, and the trend has been getting constantly larger ever since. Ie., the more oil goes up, the more the market goes down.
Unfortunately, this all seems to raise more questions than it answers. Why should oil suddenly reverse its correlation with the markets around the end of January? I tried poking around the news archives around that time but didn't find anything particuliarly significant. The unrest in Tunisia was already going on at that time, but it was a month later than when it all started. And why the big spike in positive correlation at the end of April 2010? Quite frankly, I have no clue.
It might be worth revisiting this to see what happens when oil and the markets go back into positive correlation. I wish I had a better conclusion than this, but it's still pretty interesting. Perhaps the main lesson here is that rising oil is never necessarily always either good or bad for the market. And whatever relationship it has is subject to change in a non-random fashion.
All Hail King Oil!
Bow to the barrel
All hail the King! King Oil, that is. I thought last week's crazy run-up in oil was due to Middle East politics. But this week's even bigger jump clearly indicates that Mr. Market has left the building and oil is now in the driver's seat. It matters not what candles the market put in last week so there's no point in putting up the weekly Dow chart the way I usually do.
Instead, today, we're going to look at oil, specifically crude oil futures. Here's the weekly chart going all the way back to 2008.
You may want to click on the image to view it larger. I don't know about you, but I don't like the looks of this chart. Let's start off on the right-hand edge. Two weeks ago, oil opened at 93.75. It closed last week at 106.63. That's a 14% jump in two weeks.
Are you driving 14% more than you did two weeks ago? Are the airlines flying 14% more planes than they did two weeks ago? No and no. Is Libya a major oil exporter? No. It produces 2% of the world's output. Has it all gone offline? No. And the Saudis, who aren't stupid, have indicated a willingness to make up any shortfall.
So this trend is not being driven by supply and demand, it is pure speculation, exactly the way it was back in May of 2008. In fact, that's where we have to look to find the last comparable situation, which I have conveniently circled for you on the chart.
Historical comparison
Now here's the scary part. After that jump in 2008, it took eight more weeks before we finally hit the crazy blow-off top in the first week of July. And it only gets worse. Draw down from the prices in May 2008 to the indicators below the chart. Then compare that to today. We are right now if anything even less overbought than we were in 2008, implying that oil still has as much steam to go higher now as it did then. And oddly enough, if you follow the horizontal blue line that marks our current price level back to the left, it intersects the chart at the end of April 2008, just before the big two week jump.
On top of that, we're now hearing calls for oil to hit $200, just like back in 2008.
And we all know what happened to the economy in the fall of 2008 after oil had peaked.
Good news/bad news
Now for the good news, such as it is. First of all, I think oil has the same chance of hitting $200 this year that it had in 2008, ie. none. And if anyone tries to tell you that "this time is different", you can be sure that this time is exactly the same as last time. One thing that really is different though is that the economy is in a much different place than it was in early 2008. If your plane crashes from an altitude of 10 feet, your survival odds are a lot better than if you crash from 10,000 feet. Right now, the economy is nowhere near as overheated as it was back then.
Now I suppose that there's some apocalyptic combination of circumstances that could join together this year to throw us into an even worse spot than the Great Recession, and there are some people who still keep their fallout shelters stocked, just in case, but you can't really live your whole life that way. I just find it hard to believe that that's going to happen. Not when all the hard economic news coming out lately is actually good.
Nevertheless, clearly this oil nonsense is bad for the economy. But I don't think it's the end of the world (that comes next December 21st, according to the Mayans). And if history is any guide, it might just end with another collapse of oil prices back down to more reasonable levels. Like last time.
Where to next?
So how much longer? Well here is a weekly chart of the XOI, the Amex oil index, going back the same time period:
I've drawn a rising regression trend channel on this starting with the low at the end of last June. Note that the Pearson's coefficient on this one is 0.991, an extraordinarily high number for a market regression. If you extrapolate this trend forward, where does it intersect the all-time high from 2008? June 13, 2011. Call it somewhere in the middle of June. That's when oil will hit $147 a barrel again. And oddly enough, that date is just about the same amount of time it took the last oil spike to top out. Look at the futures chart again. The peak? The last week of June 2008.
Possible outcomes
After that, it can either continue higher or collapse, just like last time. I'd be really surprised to see it go higher because I don't think the world economy can support it at this time. One other possibility is that oil will just spike exponentially and thereby hit the blow-off point before June. But based on what we've seen so far, it sure looks like we're getting ready to play 2008 over again..
So the bad news is that we still have about three more months of teeth gritting every time we fill up our tanks at the pump. But the good news is that it's not too late for you to be an oil speculator too and join in the fun. I don't normally play this sector, specifically because I believe it to be so highly manipulated, but obviously plenty of others do. And that's all she wrote.
All hail the King! King Oil, that is. I thought last week's crazy run-up in oil was due to Middle East politics. But this week's even bigger jump clearly indicates that Mr. Market has left the building and oil is now in the driver's seat. It matters not what candles the market put in last week so there's no point in putting up the weekly Dow chart the way I usually do.Instead, today, we're going to look at oil, specifically crude oil futures. Here's the weekly chart going all the way back to 2008.
You may want to click on the image to view it larger. I don't know about you, but I don't like the looks of this chart. Let's start off on the right-hand edge. Two weeks ago, oil opened at 93.75. It closed last week at 106.63. That's a 14% jump in two weeks.Are you driving 14% more than you did two weeks ago? Are the airlines flying 14% more planes than they did two weeks ago? No and no. Is Libya a major oil exporter? No. It produces 2% of the world's output. Has it all gone offline? No. And the Saudis, who aren't stupid, have indicated a willingness to make up any shortfall.
So this trend is not being driven by supply and demand, it is pure speculation, exactly the way it was back in May of 2008. In fact, that's where we have to look to find the last comparable situation, which I have conveniently circled for you on the chart.
Historical comparison
Now here's the scary part. After that jump in 2008, it took eight more weeks before we finally hit the crazy blow-off top in the first week of July. And it only gets worse. Draw down from the prices in May 2008 to the indicators below the chart. Then compare that to today. We are right now if anything even less overbought than we were in 2008, implying that oil still has as much steam to go higher now as it did then. And oddly enough, if you follow the horizontal blue line that marks our current price level back to the left, it intersects the chart at the end of April 2008, just before the big two week jump.
On top of that, we're now hearing calls for oil to hit $200, just like back in 2008.
And we all know what happened to the economy in the fall of 2008 after oil had peaked.
Good news/bad news
Now for the good news, such as it is. First of all, I think oil has the same chance of hitting $200 this year that it had in 2008, ie. none. And if anyone tries to tell you that "this time is different", you can be sure that this time is exactly the same as last time. One thing that really is different though is that the economy is in a much different place than it was in early 2008. If your plane crashes from an altitude of 10 feet, your survival odds are a lot better than if you crash from 10,000 feet. Right now, the economy is nowhere near as overheated as it was back then.
Now I suppose that there's some apocalyptic combination of circumstances that could join together this year to throw us into an even worse spot than the Great Recession, and there are some people who still keep their fallout shelters stocked, just in case, but you can't really live your whole life that way. I just find it hard to believe that that's going to happen. Not when all the hard economic news coming out lately is actually good.
Nevertheless, clearly this oil nonsense is bad for the economy. But I don't think it's the end of the world (that comes next December 21st, according to the Mayans). And if history is any guide, it might just end with another collapse of oil prices back down to more reasonable levels. Like last time.
Where to next?
So how much longer? Well here is a weekly chart of the XOI, the Amex oil index, going back the same time period:
I've drawn a rising regression trend channel on this starting with the low at the end of last June. Note that the Pearson's coefficient on this one is 0.991, an extraordinarily high number for a market regression. If you extrapolate this trend forward, where does it intersect the all-time high from 2008? June 13, 2011. Call it somewhere in the middle of June. That's when oil will hit $147 a barrel again. And oddly enough, that date is just about the same amount of time it took the last oil spike to top out. Look at the futures chart again. The peak? The last week of June 2008.Possible outcomes
After that, it can either continue higher or collapse, just like last time. I'd be really surprised to see it go higher because I don't think the world economy can support it at this time. One other possibility is that oil will just spike exponentially and thereby hit the blow-off point before June. But based on what we've seen so far, it sure looks like we're getting ready to play 2008 over again..
So the bad news is that we still have about three more months of teeth gritting every time we fill up our tanks at the pump. But the good news is that it's not too late for you to be an oil speculator too and join in the fun. I don't normally play this sector, specifically because I believe it to be so highly manipulated, but obviously plenty of others do. And that's all she wrote.
Friday, March 4, 2011
More upside possible
Well how do you like that? The Magic 8 Ball was right on the money. We were rewarded today with a 191 point jump in the Dow. It's still too soon to call this a trend, what with all the up-down-up-down action recently, but I will note that we hit several important numbers today.First, the opening and low of the Dow were identical and equal to the center line of the long term rising weekly RTC. Second, we closed above the 12,225 resistance shelf established last month. And third, we exited out the right side of the descending daily RTC from last month. All of these are bullish indicators. Note also that the classical indicators are all lower than they've been in well over a month and appear to have bottomed and started turning up. Also bullish.
However, after today's big run up, I'm not expecting the same tomorrow. The pattern lately after big pops has been a period of consolidation for a few days before resuming any meaningful price movement. Still I'm liking this chart more than I was two days ago. We'll see.
No trades today.
Thursday, March 3, 2011
Riding the See Saw

What a roller coaster today. The Dow crossed its zero change level around a dozen times before finally closing up just under 9 points. Nice for the day traders, not so nice for swing trading. Up, down, up, down - here's my new forecasting tool. It should work at least as well as I've been doing the last few days.
One thing seems clear, the support at 12K held firm (as did the 1300 level on the S&P) as the bears were unable to knock 'em any lower today. We have also gone from quite overbought to fairly oversold in the last two weeks. And all three futures are up right now (1:15 AM). The ES in particular is up avery respectable 0.75%, with NQ and YM not far behind that. And the VIX put in a big tall doji signaling a possible reversal. So let me turn the Magic 8 Ball over and see what it says. Hmm, "market may go higher Thursday". That's all I got.
Trades
When I checked the market when I got up, I was up a bit. When I checked back after breakfast, I was down big. After lunch I was up again, and so on. I finally did end up losing 0.27% today, but largely because NRF, one of my low price/high yield names announced a secondary after hours today and took a dump.
I'm in a decent profit position in NRF from 3.13 last summer and it's had a good run. I may start cutting back on it soon, especially since it is now the low yielder in the LP/HY portfolio. To quote R. Lee Ermey, "I'll be watching you!"
I did pick up some TIE at 18.02. I also tried buying some AUY but that proved to be a mistake, so I took a small loss and got back out.
Wednesday, March 2, 2011
Crossroads
Wow, I sure wasn't expecting today's 168 point drop in the Dow. Even upon further review, as they say, I still see nothing in yesterday's technicals that could have foreseen this. But it is what it is. The uptrend I thought was starting is hereby canceled, and after just one day, I'm taking the green trend arrow back down. Honestly, I now have no clue where the market may be headed in the near term.In fact, today's nasty surprise leaves us at an important crossroads. Tomorrow may well determine if we're actually in a longer downtrend that began on February 22nd, or if the 12K support level can hold once more as it did twice last week and send us back higher. On the downside, the futures are all trading lower by 0.2 to 0.3% right now (1:30 AM EST). And even worse, we are now nearly down to the lower edge of therising ES weekly RTC that goes all the way back to last August. Dropping below current levels would be quite a bearish sign.
All in all, it feels like Mr. Market's mood has suddenly turned glum. Whether it's the price of oil, civil war in Libya, Bernanke's commentary, or whatever, I'm taking the long hat off and reaching for the short hat.
In fact, if this keeps up I'm just going to take a vacation. This is not my kind of trading environment. Especially if we're up tomorrow. I don't like it when I get out of sync with the market and I just hate getting whipsawed. Better to just stand aside until things calm down a bit.
Trades
Today I got out of my WIN trade at 12.63 for a small profit. I'm slowly increasing my cash position and am now 39% in cash, my highest level in quite some time now. I also bought a 20 put as insurance on my holdings in GE. That's a stock I don't really want to sell, but it's looking like it may go lower still. It has now broken under a rising weekly RTC channel.
Tuesday, March 1, 2011
Still on track for higher
Over the weekend, I called for the Dow to go higher today and sure enough, we got a nice 96 point advance. My long hat fit quite nicely today.Because of the dramatic decline from last week, I added the Fibonacci retracements to today's chart. Notice how the Dow advanced to the 0.618 Fibonacci retracement literally on the dot, at 12,235, the high for the day, before closing at 12,226. There was also some minor resistance at this level the last time we encountered it (on February 8th) but this time we're not nearly as overbought as we were then so I don't think that's going to present much of an obstacle tomorrow.
Then there's our friend the VIX. It continued its decline today and shows no sign of reversing just yet. Plus tomorrow is the first day of the month, traditionally a strong day. The Dow has been up 9 of 11 on March 1st from 1996-2006, according to The Stock Traders Almanac.
Finally, given the fact that all three futures are up convincingly right now (1:30 AM EST) with the ES leading the way up 0.34% and no new catastrophes out of the Middle East, I'd say we still have room to run tomorrow. And since today's green candle was entirely outside the descending RTC from last week, I'm going to put the green swing trend arrow back up.
Trades
I unloaded my Intel today at 21.43. On a day where the rest of the market was up, INTC was down. I don't particularly like its daily chart so I decided to take some profit rather than holding out for more and ending up with nothing. I just wasn't feeling the love.
My new spec play WIN meantime continued its advance on higher volume to close at 12.54 in the regular session and then popping to 12.70 in after hours.
I finished February with a decent 5.48% gain. I'm actually happy to see anything north of my long term average of 2.5% per month. We'll see if March can roar in like a lion.
Monday, February 28, 2011
Still on track for Monday
At 1:10 AM, all three futures are down, but only slightly, with the ES losing just 0.09%. And it has been trending higher since 8:45 this evening. And no new disasters out of Libya to this point. So I think I'm going to stick to the calls I made in my last post. There's still no swing trend that I can figure out, but I'm reaching for my long hat.
Quote of the Week
Sometimes the safest course of action is the most dangerous. As General Patton said, "L'audace, toujours l'audace".
Quote of the Week
"Most people lose money trying to avoid losses."This is from a webinar sponsored by Linda Raschke that I attended last week. I'm sorry, but I don't seem to have the name of the presenter handy at the moment. But it's a great quote and well worth remembering.
Sometimes the safest course of action is the most dangerous. As General Patton said, "L'audace, toujours l'audace".
Sunday, February 27, 2011
Weekly Review

The holiday-shortened week was pretty awful by any account. It did have one benefit though: the drop of over two percent for the week took some of the froth out of the market and helped clear the air like a thunderstorm on a steamy summer afternoon. All the daily indicators, which were looking overbought at the start of the week, are now looking more oversold than any time since last August.
But that doesn't really show up on this weekly chart of the Dow. What's of note here is that the Dow remains in a primary uptrend that goes back to June 28, 2010. That's quite a run. And even with this week's big drop, we remain in the upper half of the rising regression trend channel. But if you look at the last two times we had a big drop in this channel, the following two weeks drifted lower.
But Monday is the last trading day of the month and Tuesday is the first day of the following month. Both of these are historically strong, and as I said, the daily chart is looking oversold now. So my strategic outlook for next week would be higher prices in the early part of the week, possibly followed by declines later on. A rise on Monday is also supported by the daily candles: a hammer on Thursday and a bullish engulfing pattern Friday. That's a strong reversal signal.
Of course, this all assumes there's no new news out of Libya. Barring any drastic changes over there, it appears that the Short Attention Span Theatre that is the stock market has moved on.
Finally, with three days up, three days down, one day up and the expectation of another day up on Monday, there is no swing trend so I've removed the red arrow and put up the "no clue" symbol. As a reader mentioned yesterday, the day traders love this sort of environment. It's less than ideal for swing trading.
A Note on the VIX
I've been focusing on the VIX recently. It looks like my theory about the correlation between the VIX and the market held nicely this week. The VIX took a big jump on Tuesday and Wednesday. Then it started to fall on Thursday. The S&P continued to fall Thursday but rose exactly one day after the VIX started falling. The daily VIX still has room to fall, supporting my expectation of higher stock prices on Monday.
A Note on Oil
The big noise this week was all about oil, due of course to the Libya situation. Does anyone remember the summer of 2008 when oil went exponential peaking that summer around $147 a barrel? Shortly before then, someone (I think is was GS) came out with a prediction that oil would hit $200 by fall. And we all know how that ended. Well, this past week I heard no fewer than three people predicting that oil is going to $200. That does it - the run up in oil is now officially over.
Performance
Although the markets were terrible this week, I still managed to end the week almost break even, finishing with just a 0.17% decline on the week. I managed to post some good results on Thursday and Friday, nearly offsetting my losses earlier in the week. I did take one lesson away from this week and that is to listen to my own forecasts. By Monday night, anyone could have seen Tuesday's drop coming a mile away. I really try not to play the "woulda coulda shoulda" game, but I shoulda taken out a few short contracts in ES at that point.
If I'd been wrong and the market had gone higher, I would simply have been left no worse off than before. And if I was right and the market tanked Tuesday, I could have insulated myself from some demoralizing losses. That's a no-lose situation.
Year to date, I am now up 8.11%; the Dow is up 4.77%. My maximum winning streak is four days and maximum losing streak is two days. Sharpe ratio is 0.33 and win/lose ratio by day is 1.92.
As expected, my spec play in WIN was up on Friday. It goes ex-dividend lat next month but I may not hold it that long. For now, it's moving the right direction and still has room to run.
Friday, February 25, 2011
Going higher
The most interesting chart today was this one, the daily VIX. Recall how a few days ago I said that the VIX rarely continues to climb after gapping up to its upper Bollinger band. I was one day early as it turns out. Yesterday the VIX managed one more push higher. Today it made another attempt at its 200 day moving average but that was rejected too. Even more importantly, the resulting candle was a classic dark cloud cover. That is a strong reversal signal.Now recall my recent post on Monday about how the VIX can predict the market. Today the VIX peaked and started going back down while both the Dow and the S&P continued their declines for the third straight day. I did a cross-covariance on the VIX that seemed to suggest that when the VIX peaks, the market will turn around within a day or two.
So the VIX seems to be saying that the market is ready to go higher either tomorrow or the next day. Supporting this is that the recent downturn has taken all of the indicators off their highly overbought conditions to oversold conditions. In fact, they are all a lot more oversold than they were after the last big dump on January 28th.
Add to all of this that all three futures are up significantly right now (1 AM EST), the ES and YM in particular both being up 0.42% with the NQ even higher, and I'm fairly confident in saying we're due to go higher tomorrow. Of course, the big caveat here has to do with Libya. If Col. K. does something really outrageous (though its hard to imagine him acting any more outrageous than he already is), that will definitely trump the technicals.
Trades
Today I took a speculative flyer in a company called Windstream (WIN). It took a beating recently but seems to have found a bottom and received an analyst upgrade two days ago. Greatly decreased selling volume seems to indicate that we're running out of sellers at this level. Its 8.14% dividend doesn't hurt either. We'll see if this does anything. I'm in at 12.22; it closed at 12.29.
Thursday, February 24, 2011
Libya Runs the Market
Well, I guess I might as well cancel my subscription to eSignal now. Charts no longer seem to matter in this market. All anyone seems to care about anymore is the demented rantings of some psychopath on the shores of Tripoli. Bottom line, the market's not going to go up until Kolonel Khadafi Kalls it Kwits.
Technically, we've entered a swing downtrend, since today's further 107 point drop in the Dow provided a bearish signal. Accordingly, I'm putting up the red arrow. I was wrong yesterday about a turn-around today. Call me an eternal optimist, but after today's further rise in the VIX, it would be highly unusual for it to continue higher still tomorrow. The VIX also hit its 200 day moving average today and backed off it. The Dow is also near its very strong support level at 12,000, and the S&P is close it its own 1300 support. All of this is making me leery of going short here. And I note that all three futures are actually up right now (2 AM EST) for a change.
But like I said in the beginning, Wall St., uh I mean Benghazi St. only seems to care about one thing now. Yes, Libya's oil output is in danger. Libya produces all of 2% of the world's oil. A good part of that goes to France and Italy. It's not the end of the world, folks. The real problem now I'm afraid is that the same speculators who brought us $147 oil back in the summer of 2008 are back to the table to stuff their pockets some more, probably with the same eventual results, unfortunately.
In the meantime, we have our Fearless Leader in Washington boldly issuing Stern Warnings to Colonel Klink to the effect that "you ought not do that". Oh gosh, I'm sure he is just shaking in his boots. Mr. President, you are supposedly the leader of this nation. This might be a good time to exhibit some actual leadership, you know what I'm saying?
Technically, we've entered a swing downtrend, since today's further 107 point drop in the Dow provided a bearish signal. Accordingly, I'm putting up the red arrow. I was wrong yesterday about a turn-around today. Call me an eternal optimist, but after today's further rise in the VIX, it would be highly unusual for it to continue higher still tomorrow. The VIX also hit its 200 day moving average today and backed off it. The Dow is also near its very strong support level at 12,000, and the S&P is close it its own 1300 support. All of this is making me leery of going short here. And I note that all three futures are actually up right now (2 AM EST) for a change.
But like I said in the beginning, Wall St., uh I mean Benghazi St. only seems to care about one thing now. Yes, Libya's oil output is in danger. Libya produces all of 2% of the world's oil. A good part of that goes to France and Italy. It's not the end of the world, folks. The real problem now I'm afraid is that the same speculators who brought us $147 oil back in the summer of 2008 are back to the table to stuff their pockets some more, probably with the same eventual results, unfortunately.
In the meantime, we have our Fearless Leader in Washington boldly issuing Stern Warnings to Colonel Klink to the effect that "you ought not do that". Oh gosh, I'm sure he is just shaking in his boots. Mr. President, you are supposedly the leader of this nation. This might be a good time to exhibit some actual leadership, you know what I'm saying?
Wednesday, February 23, 2011
Recovery possible
Yesterday, in a post entitled "Not looking good for tomorrow", I wrote "I am definitely reaching for my short hat."Well the short hat fit quite nicely today, although you certainly didn't need to be Carnac to see this one coming. Today's ugly 178 point dump in the Dow was a market forecaster's lollypop. And while painful, it was probably a good thing as it helped let a bit of air out of the balloon that was pumping up a bit too fast. It makes absolutely no sense for the Dow to be up seven percent after just 35 sessions this year. That sort of gain is obviously unsustainable.
So where next? Today, I bring you the daily chart not of the Dow, but of the YM futures, because I think they hold the key to tomorrow. Since it's already 1 AM, the rightmost candle is Wednesday's. It looks to me like we're replaying the action of January 28th, the last big drop we had in the Dow. And the next day we were up. That looks to be getting ready to happen again. Right now, all three futures are up by about a third of a percent.
I think today's decline was really overblown, driven more by angry mobs in Libya than any real economic basis. Indeed, the two pieces of economic news that came out today were better than expected, but the market was having none of it. I'm guessing that tomorrow, cooler heads will prevail.
I also want to show you this picture of the daily VIX, since I was just talking about it yesterday, and also because this chart is so dramatic:
It's not often you see the VIX gap up in a big way from the center of its Bollinger band range, actually opening at the upper BB and then closing even higher. Looking back through the history, it appears that every time that happens (and it isn't often), the next day the VIX goes lower. And that of course means the market turns higher.So if we do go lower tomorrow, I'll have to start a new descending RTC and put up the red swing trend arrow. Otherwise, I'm taking my short hat off and reaching for my long hat now.
Trades
No trades today. I'm kicking myself for once again failing to capitalize on the short side, but the carnage was mostly over in the first two minutes of trading right out of the gate, and that's just not my style. So I just had to take the heat and wait for things to improve, which there is no doubt will happen. However, I think I'm going to start experimenting with taking a short position in ES the night before the next time this sort of situation presents itself.
Monday, February 21, 2011
Not looking good for tomorrow
The Stock Traders Alamanc has two warnings for us right now: "End of February Miserable in Recent Years" and "Dow Down 9 of Last 12" for the coming week.
And right now, that sure seems to be the way it's shaping up. The futures are all down by more than I've seen in a while. The ES and NQ are both down over one and a quarter percent right now (1:20 AM EST), a very significant drop. The last time they were this bad was on January 28th, the day we took a 160 point dump in the Dow. And we have extra guidance from the futures since they've been trading for one day longer than usual with the markets being closed for a holiday. They were also down in yesterday's trading.
And with renewed unrest in the Middle East, this time Libya, things are not looking good for tomorrow morning. However, until we see a new trend develop in the Dow, the "X" trend end symbol stays in place. But I am definitely reaching for my short hat.
And right now, that sure seems to be the way it's shaping up. The futures are all down by more than I've seen in a while. The ES and NQ are both down over one and a quarter percent right now (1:20 AM EST), a very significant drop. The last time they were this bad was on January 28th, the day we took a 160 point dump in the Dow. And we have extra guidance from the futures since they've been trading for one day longer than usual with the markets being closed for a holiday. They were also down in yesterday's trading.
And with renewed unrest in the Middle East, this time Libya, things are not looking good for tomorrow morning. However, until we see a new trend develop in the Dow, the "X" trend end symbol stays in place. But I am definitely reaching for my short hat.
Trading Goals for 2011
Well I guess I might as well post my trading goals for 2011 before 2011 is over. It's hard to believe it's almost the end of February already. Like I always say, time flies whether you're having fun or not.
Every serious trader needs goals. If you don't have any goals, you're just not serious. But they have to be good goals. Bad goals are worse than none. When I first started trading, I had some really awful goals. The worst one was probably the one where I was going to make money every single day. Of course, that's just not feasible. Naturally, I failed to meet that goal, which resulted in frustration, which negativelt affected my performance, blah blah vicious circle etc.
I think I've gotten better at it. So here without further ado, is what I hope to accomplish this year.
1. Performance: I'd like to at least match the results I've posted the last two years, being at least a 30% annual return on capital.
2. Size: I want to increase my trading size. This is the only way to get richer without taking on additional risk (meaning the risk associated with investment type).
3. Strategy: I want to make fewer Stupid Trades. These are generally caused by lousy entry points. I need to analyze my entires more closely before pulling the trigger.
4. Diversification: No, not investing in different sectors. I want to explore different types of trading. Arbitrage is one thing I'd particularly like to learn more about this year.
That's about it. That's enough. I'm doing well on some of my earlier goals, which at one point or another included simpler things like "not losing money", "beating the Dow", "keeping a trading journal", and "not beating myself up for not meeting goals".
Every serious trader needs goals. If you don't have any goals, you're just not serious. But they have to be good goals. Bad goals are worse than none. When I first started trading, I had some really awful goals. The worst one was probably the one where I was going to make money every single day. Of course, that's just not feasible. Naturally, I failed to meet that goal, which resulted in frustration, which negativelt affected my performance, blah blah vicious circle etc.
I think I've gotten better at it. So here without further ado, is what I hope to accomplish this year.
1. Performance: I'd like to at least match the results I've posted the last two years, being at least a 30% annual return on capital.
2. Size: I want to increase my trading size. This is the only way to get richer without taking on additional risk (meaning the risk associated with investment type).
3. Strategy: I want to make fewer Stupid Trades. These are generally caused by lousy entry points. I need to analyze my entires more closely before pulling the trigger.
4. Diversification: No, not investing in different sectors. I want to explore different types of trading. Arbitrage is one thing I'd particularly like to learn more about this year.
That's about it. That's enough. I'm doing well on some of my earlier goals, which at one point or another included simpler things like "not losing money", "beating the Dow", "keeping a trading journal", and "not beating myself up for not meeting goals".
Can the VIX Really Predict the Market?
The VIX as a market predictor?There was an interesting article in www.seekingalpha.com a few days ago, here: http://seekingalpha.com/article/252838-4-reasons-the-stock-market-has-doubled?source=tracking_email#comment-1481460. Although the main theme was on why the market's been on such a tear lately, there was an interesting digression in the comments about the VIX and whether or not it has any predictive powers as far as the market is concerned.
Now many people, myself included, do use the VIX to try to get a handle on future market moves. And I've found it to be quite useful, but I thought it was time to put the issue to the test, Mythbusters-style. So I decided to crank up Matlab and do a little math.
The Experiment
I started by collecting closing daily values of the Dow, the S&P, and the VIX, going back to 12/11/09. That's 300 sessions. I chose that number because that was all I could get eSignal to cough up. There's no obvious way I can see to tell it I want more data.
In any case, I thought that doing a cross-covariance of the VIX with the Dow or S&P might prove revealing. Let's start off with the raw data. Here's the S&P (in blue) and the Dow (in red) from 12/11/09 to 2/18/11. I divided the Dow numbers by 10 so both plots would display nicely on the same graph. (Click on the image for a larger version)
They look pretty similar, right? Basically what you'd expect.Now let's do a simple cross-covariance on these two datasets just to get a feel of what the xcov function looks like. Recall that the cross-covariance is just the cross-correlation function of two sequences with their means removed. Imagine having both graphs printed on transparencies and sliding one past the other looking for points where they either line up or don't. That's what the x-axis shows here - how far away from their starting position the two graphs are.
Pretty much what you'd expect, right? There's maximum correlation between the Dow and the S&P right in the middle, which represents the zero-lag point. As you slide one past the other in either direction, the correlation decreases, and it does it symmetrically. So - nothing to see here. The Dow cannot predict the S&P, and vice-versa.Right about here, I'm having nightmares about some savant working for Goldman Sachs in a big room surrounded by racks of massively parallel supercomputers laughing at my puny efforts, but bear with me. It's new to me, at least.
Now let's take a look at the VIX for the same period:
Kind of looks like an inverse of the markets, right? Which it should. When the VIX is up, the market is down and vice-versa.The $64,000 question is, how often, if ever, does the VIX go up the day before the market goes down? So let's do the cross-covariance of the VIX with the market.
Here's the result using the S&P:
Hmmm, very interesting. First of all, as expected, the zero lag spot (the middle of the x axis), has a big spike downward, illustrating how the VIX is highly negatively correlated with the market (VIX up, market down & vice versa). But now, focus both left and right of the center line. Notice how, unlike the xcor of the Dow with the S&P, here the left and right halves to the graph are decidedly asymmetrical. There is predictive power here.To make this a bit more clear, let's try an example with two really simple data sets. a is just [1 2 3 4 5 6 7 8 9 10 9 8 7 6 5 4 3 2 1]. b is [2 3 4 5 6 7 8 9 10 9 8 7 6 5 4 3 2 1 2]. Ie. b is the same thing as a, but it peaks one position sooner (one day if you will). This means that b can be used as a predictor for a. When b peaks, you know a will peak the next day. Here they are in a graph.
Now let's plot the cross-covariance of a and b.
If a and b were identical, ie. completely correlated, they would have no predictive power and the graph would be symmetrical about the center of the y-axis. Not so here. Note that a and b are identical except that b peaks one day earlier. From day 9 to 10, b is falling while a is still rising. In every other spot, both a and b rise and fall together. This one discrepancy can be seen as the asymmetry in the curve. This is exactly what we see in the VIX cross-correlation. Let's zoom in on it.
Note that the slope of every day to the right of the center of the graph (point 300) is lower than that on the left. This represents places where the VIX has changed direction before the S&P.Let's check this on the actual data. Here's the last 11 days of the S&P, with the corresponding VIX overlaid in red. The y-axis numbers are S&P prices. The VIX values have been scaled to look nice.
Here we see that the VIX rose from the 4th to the 8th where it peaked. Meanwhile the S&P was also rising, but it peaked on the 8th, then declined on the 9th. The VIX peaked one day before the S&P!Then the VIX bottomed on the 11th and started rising. Meanwhile the S&P peaked on the 14th, one day later! It certainly appears that there's something to this.
Which brings us to the dreaded right-hand edge of the chart. We see that the VIX peaked on last Wednesday, the 16th. It fell Thursday and Friday. Meanwhile the S&P has been rising since the 15th. Watch for the next VIX bottom. Let's see what the S&P does the next day.
Conclusion
Of course, this is just a tiny sample, but it sure looks promising. So what's the bottom line? It definitely appears that the VIX can be used to predict the short-term movement of the market. This leaves the questions of how much, how well, and what other outside influences might exist, but this post is long enough. That will have to wait for Part Two.
Thursday, February 17, 2011
Happy Birthday!
Happy Birthday - the Night Owl Trader is one year old today. I really can't believe it's been a year already. It's been work putting together at least a little bit every night, but it's also fun and serves as my trading diary. If anyone else out there gets something out of it, so much the better. And I know I do have some folks out there reading, so I do appreciate that too.Since starting the blog a year ago, I've added a few features, like the at-a-glance swing trend arrow and little chart snapshots, plus occasional features like the Chart of the Week and Weekend reading. Finding the time to do this on a regular basis is the hard part. I don't know how Dr. Brett Steenbarger managed to do his Trader Feed blog every day.
Anyway, let's move on to tonight's installment. Yesterday I noted that the Dow had put in a bullish engulfing pattern candlestick. This is generally a very high probability pattern, and so it was today with the Dow closing up 30 points despite the fact that most of the economic news today missed expectations. Tomorrow should be interesting, being options expiration Friday.
Modulo that, I quote the Stock Trader's Almanac: "Day Before President's Day Weekend, S&P Down 16 of Last 19; February Expiration Day, Dow Down 7 of Last 11"Ouch! That doesn't sound too promising. However, remember that the last few years have featured the worst market since the Depression so that certainly skews the numbers. And judging by the futures, all three of which are up nearly 0.1% right now (at 1:20 AM EST) I'm just not getting any serious negative waves from the market at the moment.
Also, the closes from last Friday through Tuesday formed a support line around 12,275 which you can see in the daily chart here. Yesterday closed above that level and today both opened and closed above it. The VIX meanwhile bumped up against its 40 day MA and retreated. Its own indicators are looking overbought. So all in all, despite tomorrow's historical reputation, I don't see much to be negative about. If we do in fact go higher, I will start a new up trend then.
Trades
Today, I sold my entire position in AMD at 9.34 for a small profit. It closed at 9.44. It's had quite a run recently and this was one of my trades that turned into an investment. I was just tired of this name and think I can do better elsewhere. I think it may be pulling back tomorrow anyway.
I also unloaded my AUY at 12.31 for break-even. It closed at 12.36 but put in a hanging man and is looking at least short term overbought to me right here. This trade just wasn't a good entry. I'll be looking to buy it back lower. Meanwhile the gold index $HUI is looking toppy too.
And finally I added a bit more HIMX at 2.55 and ZTR at 3.53 to my low price/high yield portfolio.
Moving higher
There seems to be something wrong with the Blogspot editor this evening. It's not showing the image upload icons for me. And that's a shame, because the Dow today put in a classic bullish engulfing pattern suggesting that there's still more room to run even after today's nice 61 point advance. And that advance took us back over the daily pivot. It would have been a nice chart to show.
Todays positive economic news evidently canceled out the RTC warning signal. I think the only thing that could hold us back now is the fact that the day before options expiration is historically not a good one. Now the thing about the bullish engulfing pattern is that the day after it appears is typically not that good, but a day or two after that is often higher. So I don't think we'll see a major move in either direction tomorrow. The futures, meanwhile are just slightly lower right now (1:30 AM), so there's a bit of a negative bias there. Friday, being expiration day could be interesting.
No trades today,
Todays positive economic news evidently canceled out the RTC warning signal. I think the only thing that could hold us back now is the fact that the day before options expiration is historically not a good one. Now the thing about the bullish engulfing pattern is that the day after it appears is typically not that good, but a day or two after that is often higher. So I don't think we'll see a major move in either direction tomorrow. The futures, meanwhile are just slightly lower right now (1:30 AM), so there's a bit of a negative bias there. Friday, being expiration day could be interesting.
No trades today,
Wednesday, February 16, 2011
Mixed Signals
Yesterday's small doji in the Dow indicated indecision in the market's ongoing advance and also brought us to the lower edge of an RTC channel going back to the end of last month. That was a bearish setup. Then today's 42 point decline was the trigger. According to this system one should be expecting lower prices tomorrow. I also note that the Dow broke below its daily pivot today on a red candle, also a bearish sign.And finally, Monday's top exactly hit the upper end of a longer RTC going all the way back to last July. The last time that happened was 11/4/10. What followed then was nine straight days of decline. Accordingly I'm taking the green swing trend arrow down and declaring the shorter uptrend over.
However, there are no fewer than nine pieces of economic news coming out tomorrow and all three futures are up about a quarter of a percent right now (1 AM EST). This is a very tough call. I think if the news comes out better than expected, the market could ignore the RTC and continue higher. And I note that the YM futures have not given a bearish trigger and remain within the rising channel.
In any case, on a purely technical basis, the Dow chart looks poised to go lower. This is just one of those situations where you really do have to wait and see. I think tomorrow is going to be more news-driven than technically driven. Right now, I'm just planning on sitting on the sidelines until I see which way the wind blows.
No trades today.
Tuesday, February 15, 2011
Bearish setup but no trigger yet
I really thought we'd see more out of the Dow today, but today's meager 5 point drop brought us right to the lower edge of the ascending daily RTC. Accordingly, I have to treat this as a bearish setup. If we go lower tomorrow, the trend is broken. I'm also going to refrain from making daily calls this week. Being options expiration week, I should know better. So the swing trend arrow remains green but that's subject to change tomorrow.
Trades
Today I added to my position in HIMX at 2.55 and ZTR at 3.53 for my low price/high yield portfolio. HIMX has strong support at 2.50 and ZTR looks to be reversing on the stochastic.
Trades
Today I added to my position in HIMX at 2.55 and ZTR at 3.53 for my low price/high yield portfolio. HIMX has strong support at 2.50 and ZTR looks to be reversing on the stochastic.
Monday, February 14, 2011
Uptrend resumed
Last Thursday I was totally convinced the market was going lower on Friday. All of the technical indicators seemed to be lined up in that direction. That proved to be the worst call I've made in the six years I've been watching the markets closely. I can only assume that it was our good friend Egyptian former president Mubarek who came to the rescue saved the day for Wall St. by taking a powder at the last minute. Sometimes news just trumps technicals. We just have to live with that.
Anyway, the coming week could be interesting because it's an options expiration week. And historically, the expiration before President's Day is particularly bad. But we're not there yet. Right now I see all three futures up (at 1:30 AM EST) and trending higher, and the VIX unable to make any headway. So I have to take my short hat off and guess that we're going higher tomorrow.
And I also have to put the green trend arrow back up. That will teach me to jump the gun. Last Thursday didn't even give us a true bearish setup, much less a sell signal. When you have a system, you have to follow it.
Performance Update
Despite my dead wrong call for last Friday, I still ended the week up 1.16%, putting me now up 5.99% year to date just about dead even with the Dow's 6.01%. One of my annual goals is to outperform the Dow, but5 I'm not too concerned at this point since the Dow has performed spectacularly so far this year. That 6% gain so far corresponds to an equivalent of nearly 46% per year.
There is no way the Dow can keep that rate up all year long. However, I hope to be able to come in near my past two years return of just over 30%. It's still early in the race, so we'll see how things develop.
Anyway, the coming week could be interesting because it's an options expiration week. And historically, the expiration before President's Day is particularly bad. But we're not there yet. Right now I see all three futures up (at 1:30 AM EST) and trending higher, and the VIX unable to make any headway. So I have to take my short hat off and guess that we're going higher tomorrow.
And I also have to put the green trend arrow back up. That will teach me to jump the gun. Last Thursday didn't even give us a true bearish setup, much less a sell signal. When you have a system, you have to follow it.
Performance Update
Despite my dead wrong call for last Friday, I still ended the week up 1.16%, putting me now up 5.99% year to date just about dead even with the Dow's 6.01%. One of my annual goals is to outperform the Dow, but5 I'm not too concerned at this point since the Dow has performed spectacularly so far this year. That 6% gain so far corresponds to an equivalent of nearly 46% per year.
There is no way the Dow can keep that rate up all year long. However, I hope to be able to come in near my past two years return of just over 30%. It's still early in the race, so we'll see how things develop.
Subscribe to:
Posts (Atom)